
Welcome to the Process Analytics monthly newsletter.
The goal of the Process Analytics project is to rapidly display meaningful Process Analytics components in your web pages using BPMN 2.0 notation and Open Source libraries.
Although August is usually a time of vacation and rest, the project team worked hard to propose many new elements in our project:
- a new website
- the new logo
- the new R library (BPMN Visualization)
- the BPMN Visualization (JavaScript/TypeScript) library
The Process Analytics Project website
We finalized the first version of the Process Analytics project website 🎉
This site brings together all the information related to the project, especially what is necessary to make it easier for you to get started:
the project goals
the available libraries and tools,
the related articles and posts
In August, we worked specifically on better describing the goals of the project. We also added screenshots to illustrate some use cases that the project may already cover.
Last but not least, we've tweaked the site to look good on mobile devices.

New project logo
We have also refreshed our logo which is now available in two flavors: blue and white.

BPMN Visualization - R Package library
The Process Analytics team has also started a useful new project/library for the R ecosystem: BPMN Visualization - R Package.
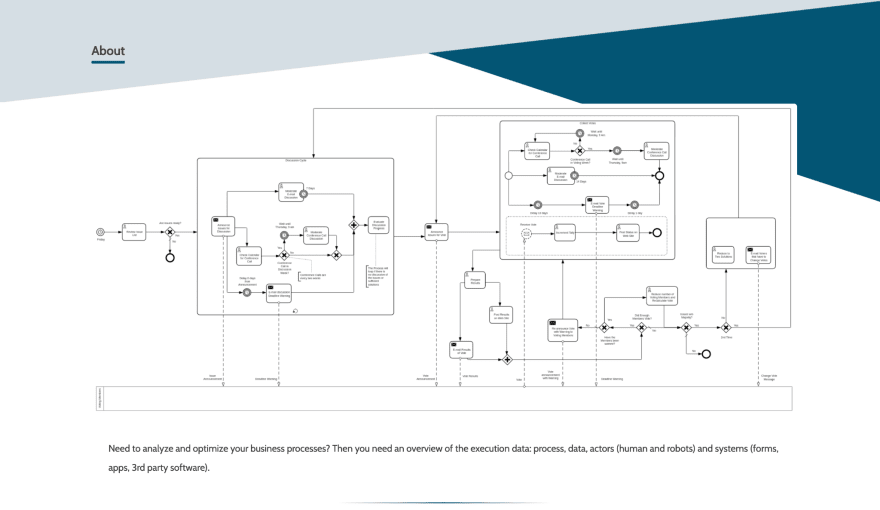
Using this library, you can visualize a process on a BPMN diagram, along with its execution data, in R projects (RStudio, Shiny applications, etc) in Process Analytics or Process Mining.
BPMN Visualization - R Package is based on the experimental implementation we made in June. You can use this new package in place of the experimental one that has been archived.
For the next months, we will be working on the following topics:
Release the first public version and make it available on CRAN.
Ability to customize the style of the BPMN Diagram.
Ability to customize the style of overlays and choose their position on the BPMN Diagram.
BPMN Visualization JS/TS library
In August, we released 2 versions: 0.18.0 & 0.19.0.
We provide better examples and have improved the BPMN support and rendering as shown below.
New BPMN support: Group

New BPMN support: Call Activity calling Global Task
The Call Activity icon is based on the one for Global Task.

BPMN rendering improvement
All activities have the same rounding whatever their size.
| Before | Now |
|---|---|
 |
 |
Plans for the future
Here are the topics we will be managing in the coming months:
Create new examples to demonstrate other Process analytics / Process Mining use cases.
Be ready to receive contributions for Hacktoberfest 2021
Add more tests to be able to upgrade mxGraph (the technical library in charge of the final rendering) to the latest version.
That’s All Folks!
We hope you enjoyed the August project news and are looking forward to
what September will bring.
In the meantime, to stay on top of the latest news and releases, follow
us through:
- Website: https://process-analytics.dev
- Twitter: @ProcessAnalyti1
- GitHub: https://github.com/process-analytics
Cover photo by Robert Collins on Unsplash

Top comments (1)
Nice website!
I am looking forward to use the R package. Graphically representing the data in RStudio seems useful!