Gender
How would you describe yourself?
- Female/Woman
- Male/Man
- Genderqueer or Gender non-conforming
- Non-binary
- Intersex
- Prefer not to say
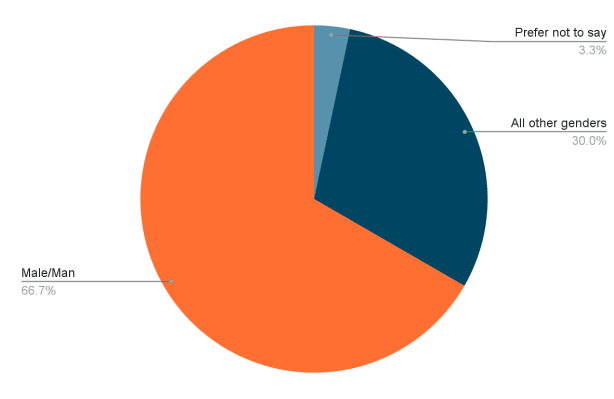
As before, let’s start by talking about processing. The data is a small set: ~150 responses total. The question we asked was a multi-select answer, which means people could choose more than one option. However, some things stand out:
- Two-thirds of the responses describe themselves as “Male/Man.”
- Although multi-select was possible, none of the men selected additional checkboxes
- 17 people selected more than one option2
We wish we had enough data to treat this with the nuance it deserves, but we simply don’t. The goal is to look at the gender pay gap, while preserving the anonymity of specific respondents. Therefore, we’ve chosen to make the following split: Those who identify as “Male” as one group, and those who picked any other option as the second group. We acknowledge that this leaves a lot to be desired, especially with the erasure and hardships gender-minority people continue to battle. We hope to rectify this in future versions of the survey.
2 an example of multiselect would be “Female/Woman” + “Genderqueer/Gender non-conforming”
Modeling salary by gender
As discussed above, there’s a lot of variance in our data, and we want to make sure we can account for it. Notably: Job Bucket; Age; Years Experience; Years in Company; and Country are of the most importance. Having created a variety of models from these columns, we seem to see a robust result of an approximate 7% increase for men over the other group (with a 90% credible interval: 14% to -1%). This is a small difference, equating to around $10,000 at the median:
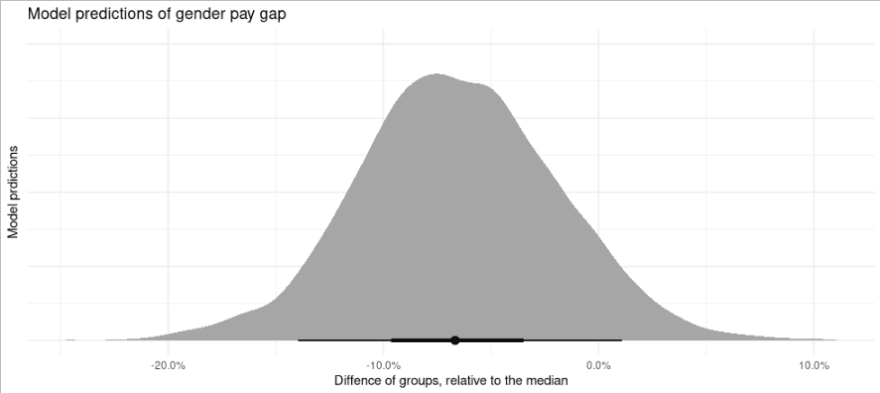
Monetary values are not reflected in the y-axis
because this prediction is about probability3
3 Imagine you plot the raw data and fit a line to it – you could read off the slope of that line and get a value for the difference between the groups. But there is uncertainty – you could fit many plausible lines. What the model does is fit all of the lines, and tell you how much more likely one slope is vs another, and what the most plausible one is. That’s what this graph is – all the possible slopes and how likely they are. The peak of the graph is the most plausible value of the gap, and the width tells you about how certain it is (high width = lots of plausible lines = low confidence).
Gender and perceived fairness of compensation
As noted previously, we collected about ⅔ of our responses from “male/men”. The data shows that Men and Not-men report being “extremely well-compensated” at the same frequency (14%). If we recall the stacks under the “Sentiment” plot, we see that 65% of men and 50% of not-men believe they’re well compensated to some degree.
Do you feel like you are fairly compensated for your job? *
| Men-only | Not-men | |||
|---|---|---|---|---|
| Extremely undercompensated | 2% | 2% | 6% | 6% |
| Somewhat undercompensated | 6% | 32% | 18% | 44% |
| Mildly undercompensated | 18% | 16% | ||
| Neutral | 8% | 10% | ||
| Mildly well-compensated | 14% | 65% | 8% | 50% |
| Somewhat well-compensated | 37% | 28% | ||
| Extremely well-compensated | 14% | 14% | ||
Gender and technicality
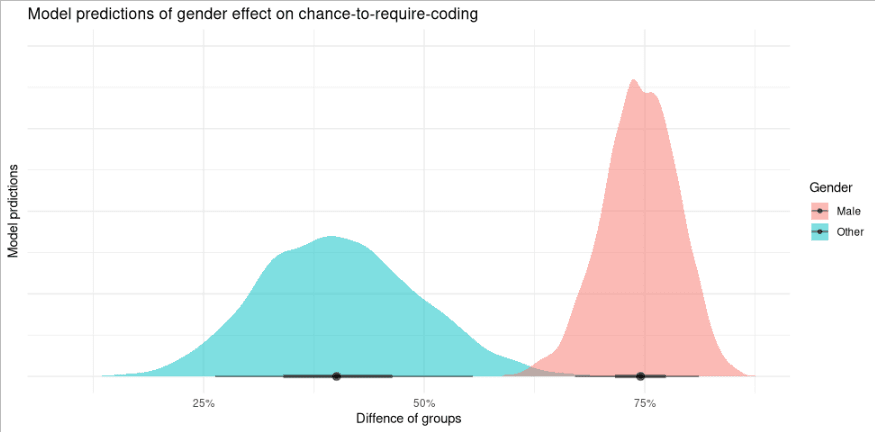
A question arose: is there any evidence of gender affecting the likelihood of holding a technical role?
In the survey, we asked whether coding was a requirement of the job. We asked in this way because many respondents can code, but don’t have to do so on a regular basis. Since we asked that, we can ask the data “What is the probability of coding, given the gender of the person?” and see what the model thinks.
This is obviously a very simple model, and many things could influence coding indirectly from gender and other sources, however for our data and simple model we see a strong impact here – males are 40% more likely to be coding than others:
Transgender and genderqueer representation
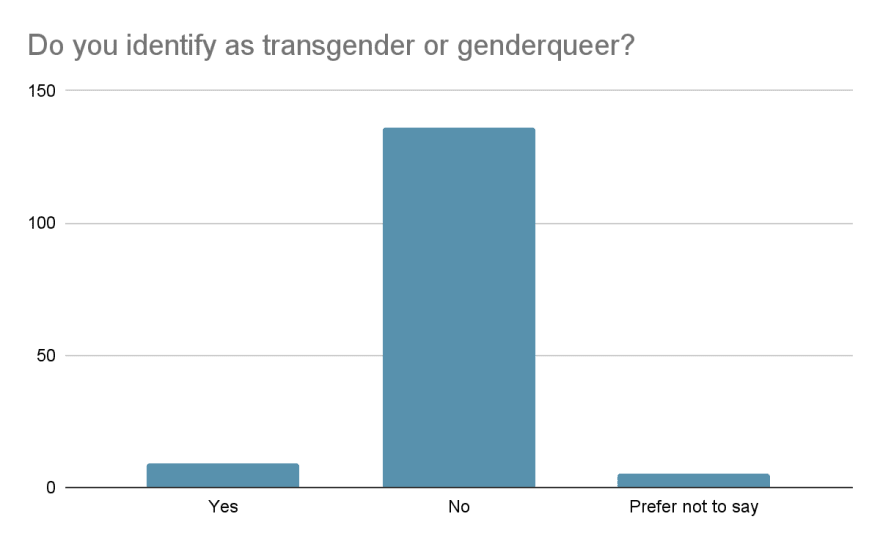
In answer to the question “Do you identify as transgender or genderqueer?” 6% responded Yes, 91% responded No, and the rest declined to answer. Because of the small sample size, it was not possible to draw many conclusions.
Gender and management
US-based manager salaries by gender
For US-based respondents of all career levels who are people managers, responses between those who marked only “Male/men” versus all others combined.
MEDIAN SALARIES
of US-based respondents (in $USD)
|
Men-only, US-based |
Everyone else, US-based |
|
| People manager | $162,000 | $165,000 |
| Strategic manager | $160,000 | $160,000 |
This table includes responses from all answers including “mid-career” level with roles involving management duties. An examination of people who are both managers and senior-level would likely show higher figures.
Gender and ageism
The tech industry as a whole is anecdotally ageist, but does gender play a further role in widening that gap? There’s not much evidence of that in our small dataset. If we model salary on age, gender and plot the predictions, we can see that while the range of predictions is large (the model is quite uncertain about the actual salaries), the pattern is consistent.
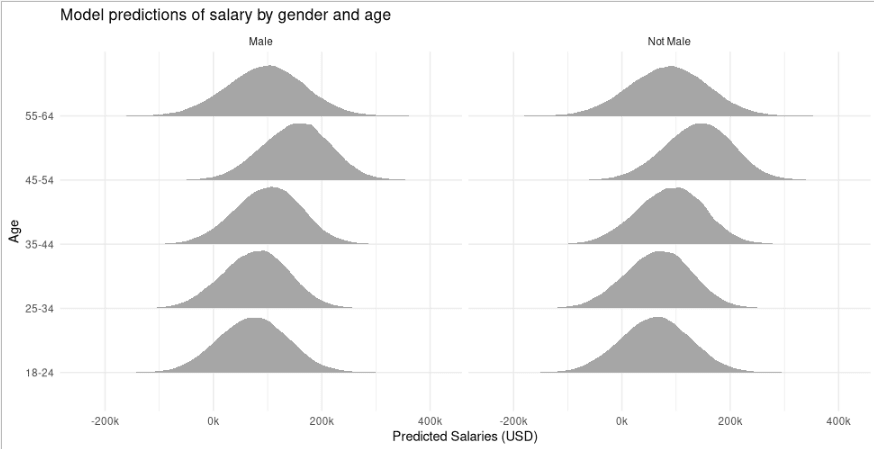
We see increasing salaries up to ages 45-54, but a drop in salary at the highest age category. However, this is true for both groups (Male and Not Male), and given the uncertainty in this model, we’re not comfortable drawing further conclusions at this time.
Career level and years in DevRel
“How many years have you been in Developer Relations? * We recognize DevRel is a relatively new title. Feel free to list how long you’ve been in DevRel-like positions.”
Career-level is self-reported as entry, mid or senior. For time in the field, we recognize that in some organizations, DevRel has become an official title more recently. Since people who currently hold the title may have performed the duties entailed in the role, we asked them to use their best judgment.
SELF-REPORTED CAREER LEVEL
| Men | Not-men | |
| Entry level | 10% | 4% |
| Mid-level | 28% | 52% |
| Senior level | 62% | 44% |
- Entry level: Ten percent of men self-report as entry-level, with a median of one year of experience in the field. Four percent of not-men describe themselves as entry-level, with a median of 2.3 years in the field.
- Mid-level: 28% of men report a median three years’ experience in the field. 52% of not-men identified themselves as mid-level with a median two years’ of experience
- Senior level: Both groups, men and not-men, reported a median of five years professional experience in DevRel. Sixty-two percent of men described themselves as senior, and 44% of not-men.
The above table shows all respondents, regardless of location. When career levels are broken out by country, we see the following:
- Of US-based respondents, 41% describe themselves as mid-level. Fifty-five percent of respondents described their career level as senior
- Of non-US respondents, 28% describe their level as mid-level, with 56% at senior level.
TABLE OF CONTENTS
CONTENTS
Pt. 1 | Pt. 2 | Pt. 3 | Pt. 4 | Pt. 5 | Pt. 6 | Pt. 7 | Pt. 8

Top comments (0)