
🔰 Beginners new to AWS CDK, please do look at my previous articles one by one in this series.
If in case missed my previous article, do find it with the below links.
🔁 Original previous post at 🔗 Dev Post
🔁 Reposted previous post at 🔗 dev to @aravindvcyber
In this article, let us introduce observability and monitoring into our stack. This we could achieve by using Cloudwatch logs and building our custom dashboard and widgets into it by setting alarms to continuously log and monitor our stack in a single place.
Additionally, we could use the cloud watch events to trigger an action or set Cloudwatch alarm to trigger a specific notification to the appropriate monitoring channels. In this demo, we will wire up our alarm to send a message to our private slack channel as follows.
New construct 🚧
We will start by creating a new file under the constructs folder like constructs/cw-dashboard-alarm-notify.ts.
So, why do we create a construct, that's because we could reuse this elsewhere in various other cases. Also when I demonstrate with a construct, it will be more generalized and easy to follow with the limited idea about the actual functional stack, which we build in our previous article.
As like every other construct which we have created previously, let us start by importing the necessary libraries as shown below.
import { Construct } from "constructs";
That should be sufficient to create a construct. Now let us define a new construct as follows with a dedicated prop as well below;
export interface MetricAlarmConstructProps {

}
export class MetricAlarmConstruct extends Construct {
  constructor(scope: Construct, id: string, props: MetricAlarmConstructProps) {
    super(scope, id);
  }
Here we have named our construct as MetricAlarmConstruct which is supposed to get the MetricAlarmConstructProps when it is getting initialized from some stack.
Here you have it, we are all set to begin defining our construct now.
Planning our construct 🚤
So the plan for this construct from now on would that we need to set up a simple dashboard for a generic log group provided from the stack which uses this construct, by making use of the various other property provided in the props.
Having said that let us first add an appName and logGroup as shown below into props.
The appName is only to distinguish the resources provisioned by setting the provided prefix to differentiate other resources provisioned alongside in the same stack.
export interface IMetricObj {
  filterPattern: IFilterPattern;
  //The below field is not yet supported in cloud formation yet.
  metricDimension: Dimension;
}

export interface DimensionFilter {
  label: string;
  DimensionMap: DimensionsMap;
}

export interface MetricAlarmConstructProps {
  appName: string;
  logGroup: LogGroup;

  metricNamespace: string;
  metricUnits: Unit;
  metricValue: string;
  metricStatistic: Statistic;
  metricName: string;

  metricDef: IMetricObj;
  metricDimensionFilter: Record<string, DimensionFilter>;
}
Note! props will be destructured 🌠
Inside our construct definition, let us use object destructuring to retain the same naming convention as we use them in our code as follows.
///// Inside the construct definition
{
     const {
      appName,
      logGroup,

      metricNamespace,
      metricUnits,
      metricValue,
      metricStatistic,
      metricName,
      metricDef,

      metricDimensionFilter,
     } = props;
}
Before we use the above properties, let me give you a high-level idea of what metric we are going to generate and use in our cloud watch dashboard.
Api Gateway Accesslog ☔
Here we will be using an access log which we have enabled in our previous API gateway, so we could extract relevant metrics by using this construct.
Also, I wanted to highlight to you that extracting status codes this way is already part of the default AWS API gateway metric namespaces, yet I did this from our code as a demonstration of the various other possibilities we have here and the flexibility we could flexibly we can use them.
Adding more imports, which we require shortly inside the construct.
import { RemovalPolicy, Duration } from "aws-cdk-lib";
import {
  LogGroup,
  MetricFilter,
  IFilterPattern,
  RetentionDays,
} from "aws-cdk-lib/aws-logs";

import {
  Alarm,
  Unit,
  Dashboard,
  AlarmWidget,
  PeriodOverride,
  Statistic,
  GraphWidget,
  LegendPosition,
  GraphWidgetView,
  Metric,
  Color,
  MathExpression,
  Dimension,
  DimensionsMap,
} from "aws-cdk-lib/aws-cloudwatch";
Defining the MetricFilter ☔
A Metric filter is created on top of a specific log group so that the log streams will be digested and metrics will be extracted into respective namespaces as follows.
const metricFilter = new MetricFilter(this, `${appName}-${metricName}`, {
      logGroup,
      metricNamespace,
      metricName: metricName,
      filterPattern: metricDef.filterPattern,
      metricValue,
    });
    metricFilter.applyRemovalPolicy(RemovalPolicy.DESTROY);
To explain in detail, we have created a metric filter, which will be used to get the count of requests.
Dimension not supported at present ☃️
However status codes like 200(Successful) or 403(Forbidden) are to be differentiated using Dimension Value Pattern. We are not able to define this inside the metricFilter construct since Dimension is not yet supported at the CDK level and I have been waiting for it. So I have decided to hack it from the console after deploying temporarily.
You can refer to this article on the API documentation under this.
https://docs.aws.amazon.com/cdk/api/v2/docs/aws-cdk-lib.aws_logs.MetricFilter.html
Also, I am following this PR, once we have this added into Cfn, and CDK we will update this article soon.
https://github.com/aws-cloudformation/aws-cloudformation-resource-providers-logs/issues/64
Now, let us import this construct into our common event stack by adding the below lines in the file lib/common-event.ts
import { MetricAlarmConstruct } from "../constructs/cw-dashboard-alarm-notify";
You could inject this new construct right after we have defined the eventGatewayALG just before we define the API gateway.
Check out our previous article on API Gateway, to understand what we have done with the API gateway.
https://devpost.hashnode.dev/aws-cdk-101-api-gateway-construct-throttle-quota-usageplans-api-keys
API Gateway Access log setup up ☄️
In this article we are not going to discuss the functioning of the API gateway, however, we will get out the log group provisioned when we enable the access logs as follows. We can use this log file inside our construct to generate metrics and build a dashboard and trigger an alarm.
const eventGatewayALG = new logs.LogGroup(
      this,
      "Event Gateway Access Log Group",
      {
        retention: logs.RetentionDays.ONE_MONTH,
      }
    );

eventGatewayALG.applyRemovalPolicy(RemovalPolicy.DESTROY);

const eventGateway = new apigw.LambdaRestApi(this, "EventEndpoint", {
      handler: eventCounter.handler,
      proxy: false,
      deployOptions: {
        accessLogDestination: new apigw.LogGroupLogDestination(eventGatewayALG),
        accessLogFormat: apigw.AccessLogFormat.jsonWithStandardFields(),
      },
});
Initialize our construct ❄️
Once the access log group eventGatewayALG is defined, we can wire this into our construct as follows.
new MetricAlarmConstruct(this, "MetricAlarmConstruct", {
      appName: "ApiGW-Event-AccessLog-Insights",
      logGroup: eventGatewayALG,

      metricNamespace: envParams.metricFilter.metricNamespace,
      metricUnits: Unit.COUNT,
      metricValue: "1",
      metricStatistic: Statistic.SUM,
      metricName: envParams.metricFilter.metricName,

      metricDef: {
        filterPattern: FilterPattern.any(
          FilterPattern.stringValue("$.requestId", "=", "*")
        ),
        //Not supported in cloudformation yet.
        metricDimension: {
          name: "RequestStatus",
          value: "$.status",
        },
      },
      metricDimensionFilter: {
        Success: {
          label: "200 Success",
          DimensionMap: {
            RequestStatus: "200",
          },
        },
        Forbidden: {
          label: "403 Forbidden",
          DimensionMap: {
            RequestStatus: "403",
          },
        },
      },
    });
Our configuration values 🧿
You could identify that we are using some envParams, this is nothing but a JSON object export which we will be building using the process.env to pass through our configuration data.
I have made the envParams readable to understand, what it refers to.


Filter pattern definition 🧩
Let us use this logGroup and extract metrics by using the filterPattern provided as follows.
 const metricFilter = new MetricFilter(this, `${appName}-${metricName}`, {
      logGroup,
      metricNamespace,
      metricName: metricName,
      filterPattern: metricDef.filterPattern,
      metricValue,
    });
metricFilter.applyRemovalPolicy(RemovalPolicy.DESTROY);
Check metric filter provisioned in console 🎯

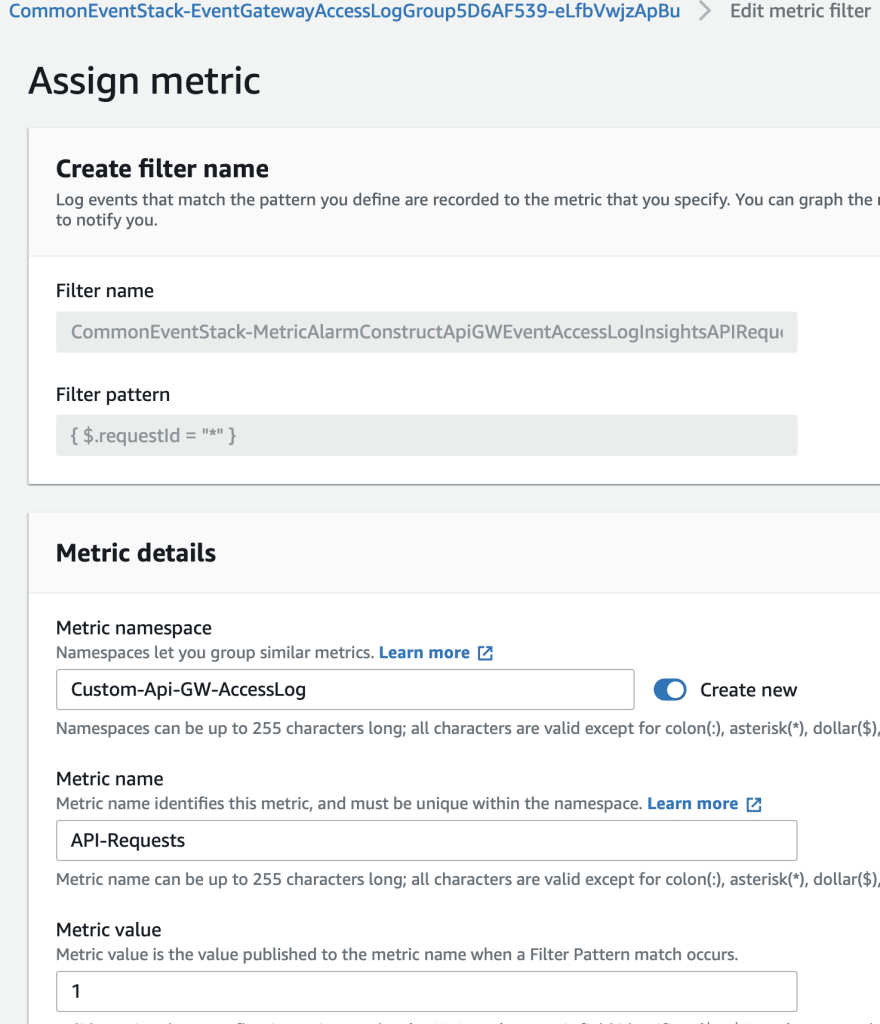
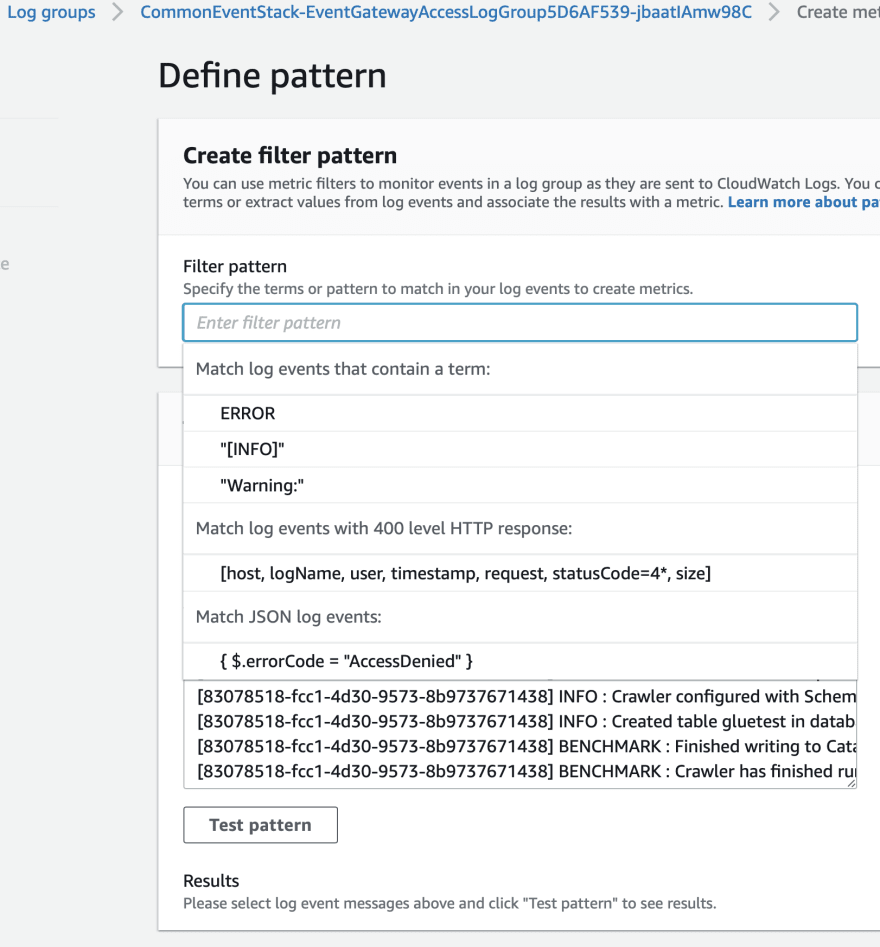
Metric Filter Pattern? 🪁
When a metric filter matches a term, it increments the metric's count. For example, you can create a metric filter that counts the number of occurrences of a specific string or it could be complex using a JSON Pattern in our case below. In any case, feel free to navigate below to the AWS documentation, which you can use to create your filter pattern.
https://docs.aws.amazon.com/AmazonCloudWatch/latest/logs/FilterAndPatternSyntax.html
You can also try this using the create metric filter option in the suitable cloud watch log group. Generally, we should test this first step by step in the AWS console, and once our pattern can get the right data we can put it into CDK to provision this programmatically.
A filter pattern is like a regex or search term which we use to check inside the log files to identify and compute our metric value. Here the unit is Count, with value 1 and we are aggregating using the SUM aggregation function.
Metric Filter hacked from console 🔮
You can very well notice that our dimension filters are not provisioned from CDK, we will hack it from the AWS console.

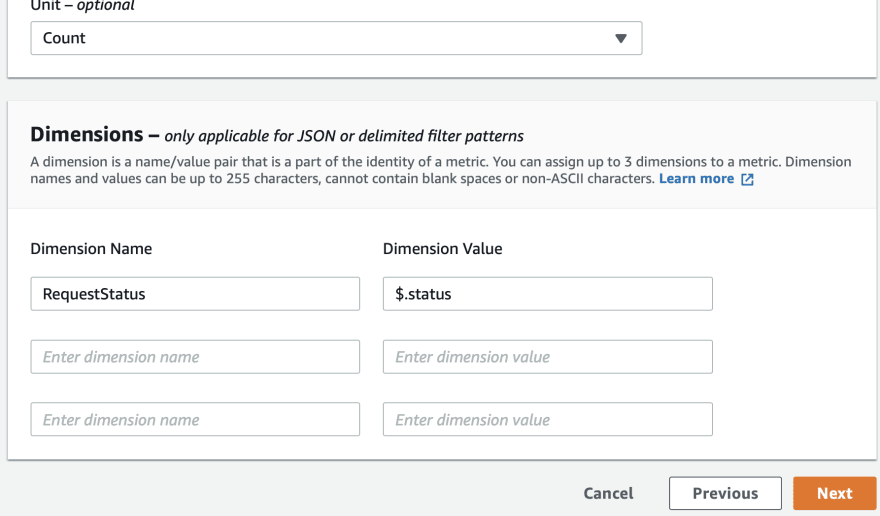


Inspect Log Group 🏓
You could also find we have defined 1 metric with the dimension filter pattern above.
However, the metrics which has been extracted out will be listed in the metrics explorer below.
But before we move forward, let us generate some logs. I did some postman API request automated testing with and without an API key.

Now should have some log streams generated in the access log group for our API gateway as follows.
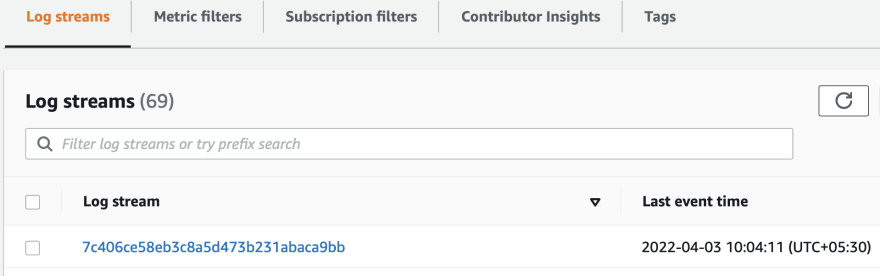
This will be picked up by our custom metric filters and posted to metrics explorer.
Find in Metrics 🎳
Navigate to all metrics in metrics explorer.

You could notice that our metric namespace Custom-Api-GW-AccessLog has dimensions generated as well RequestStatus
Drill down into our dimension to find the metric variants as follows.

Alarm and action for forbidden request 🎿
Adding new props into our construct to create an alarm and trigger a slack post using the AWS chatbot slack connection.
export interface MetricAlarmConstructProps {

    ///..........///

  alarmTopic: string;
  threshold: number;
  evaluationPeriods: number;
  datapointsToAlarm: number;

  slackConfigName: string;
  slackWorkspaceId: string;
  slackChannelId: string;
}
new MetricAlarmConstruct(this, "MetricAlarmConstruct", {
      ///..........///

      alarmTopic: envParams.sns.alarmTopic,
      threshold: 3,
      datapointsToAlarm: 2,
      evaluationPeriods: 3,

      slackConfigName: envParams.slack.slackChannelConfigurationName,
      slackWorkspaceId: envParams.slack.slackWorkspaceId,
      slackChannelId: envParams.slack.slackChannelId,
    });

//destructuring inside construct

const {

      ///..........///

      alarmTopic,
      threshold,
      datapointsToAlarm,
      evaluationPeriods,

      slackConfigName,
      slackWorkspaceId,
      slackChannelId,
    } = props;
Alarm Metric 🤿
Now let us define the alarm metric as follows:
const alarmMetric = new MathExpression({
      expression: "forbiddenCount",
      label: metricDimensionFilter.Forbidden.label,
      color: Color.BLUE,
      period: Duration.minutes(5),

      usingMetrics: {
        forbiddenCount: metricFilter.metric({
          statistic: metricStatistic,
          dimensionsMap: metricDimensionFilter.Forbidden.DimensionMap,
          unit: metricUnits,
        }),
      },
    });
Alarm creation 🥌
Wiring up the alarmMetric created above to the alarm object below.
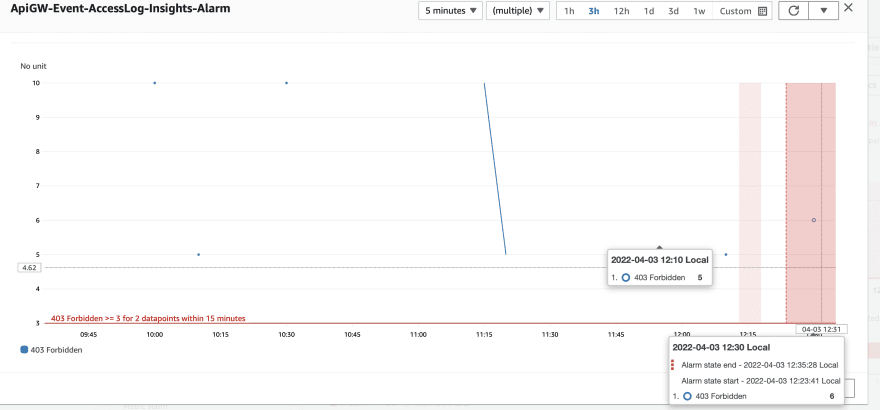
const alarm = new Alarm(this, `${appName}-Alarm`, {
      metric: alarmMetric,
      alarmName: `${appName}-Alarm`,
      datapointsToAlarm,
      evaluationPeriods,
      threshold,
    });
    alarm.applyRemovalPolicy(RemovalPolicy.DESTROY);
Once we find our threshold which is at 3 is breached by the sum of the Forbidden 403 request counter, cloud watch triggers this alarm as follows in the specified evaluationPeriods of 3. Also, we have defined datapointsToAlarm as 2, which means we only need 2 out of 3 data points to be above the threshold.


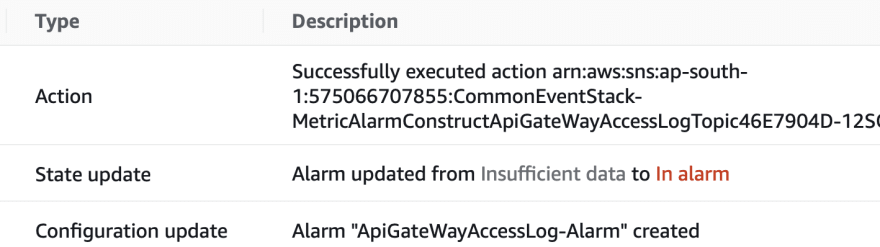
Alarm post message to SNS topic 📮
Now we need the alarm to trigger an action, here it will post to an SNS topic as follows.
const snsTopic = new Topic(this, `${appName}-Topic`, {
      displayName: alarmTopic,
      fifo: false,
    });

    alarm.addAlarmAction(new SnsAction(snsTopic));

    snsTopic.applyRemovalPolicy(RemovalPolicy.DESTROY);

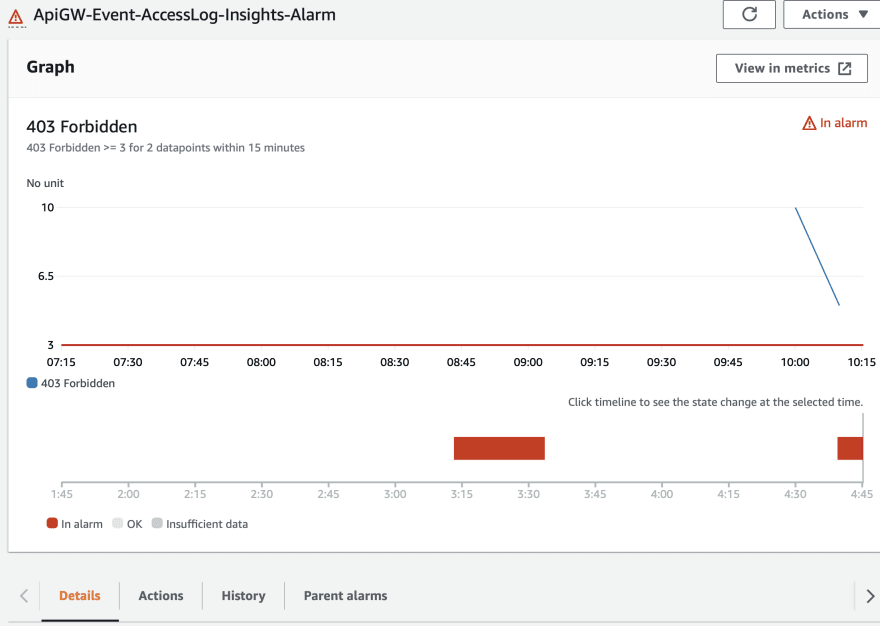
Alarm goes red 🔴
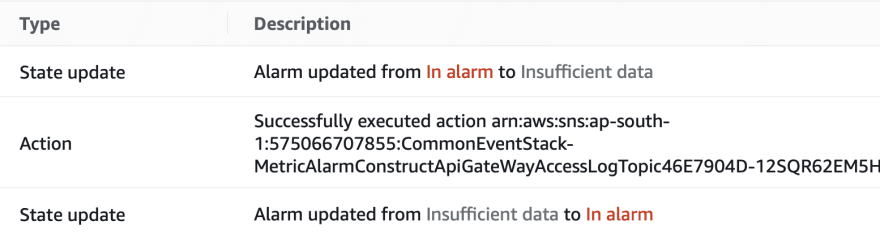
Alarm goes green 🟢
After some time this alarm goes back to green or insufficient data when the forbidden requests are reduced.


SNS topic publishes to subscribers 💠
The action enabled in our alarm will post to the SNS topic which is defined as follows.
import { SnsAction } from "aws-cdk-lib/aws-cloudwatch-actions";
import { Topic } from "aws-cdk-lib/aws-sns";
Once we have the above imports added, we could define the addAlarmAction as follows.
const snsTopic = new Topic(this, `${appName}-Topic`, {
      displayName: alarmTopic,
      fifo: false,
    });

alarm.addAlarmAction(new SnsAction(snsTopic));

snsTopic.applyRemovalPolicy(RemovalPolicy.DESTROY);
![]()
Slack Integration 🚩
Let us do the slack integration now, by wiring this up at the end of the construct to create a new slack connection configuration in the AWS chatbot.
The required items for slack connection are as follows.
- slack configuration name
- slack workspace id
- slack channel id which has AWS chatbot added integrated into it.
import {
  LoggingLevel,
  SlackChannelConfiguration,
} from "aws-cdk-lib/aws-chatbot";
Once we have the above imports, we could define the slackChannelConfiguration as follows.
const slackNotify = new SlackChannelConfiguration(this, slackConfigName, {
      slackChannelConfigurationName: slackConfigName,
      slackChannelId: slackChannelId,
      slackWorkspaceId: slackWorkspaceId,
      notificationTopics: [snsTopic],
      loggingLevel: LoggingLevel.INFO,
      logRetention: RetentionDays.ONE_MONTH,
    });
    slackNotify.applyRemovalPolicy(RemovalPolicy.DESTROY);
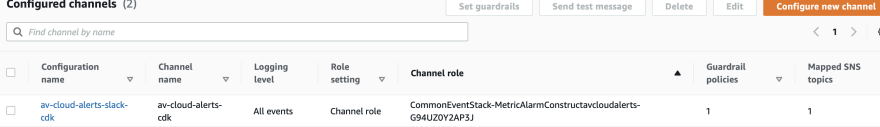
By now you could see that a new subscription is added to our snsTopic.

Slack configuration 📳
You can find more about the slack configuration in the console.
Add aws bot into your channel 📶
Create a private channel in your slack workspace and add the AWS bot integration as shown below.

Once the alarm goes on, it will send a message using the SNS topic, which is subscribed by our AWS chatbot slack connection configuration.

You can now click the above notification to find the channel which has the post message.
In case, rather than checking and deleting multiple emails, this slack channel setup helped to have them streamlined and flexible to work with.

New dashboard to track 📡
Let us wrap up by creating our dashboard, where will be adding a couple of widgets listed below.
- GraphWidget which has both the dimensions in the chart
- AlarmWidget which has the alarm metric and the threshold
const dashboard = new Dashboard(this, `${appName}-Dashboard`, {
      dashboardName: `${appName}-Dashboard`,
      end: "end",
      periodOverride: PeriodOverride.AUTO,
      start: "start",
});
Add a new dashboard GraphWidget.
This will be having a left and right metric one for each status 200 and 403 with the suitable label, color, and dimensions Map.
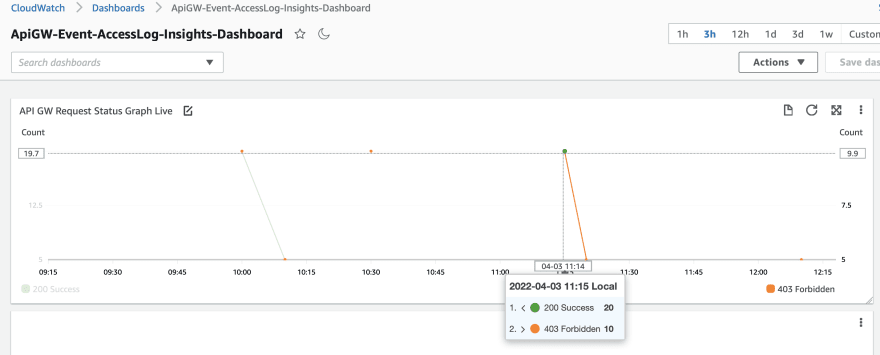
 dashboard.addWidgets(
      new GraphWidget({
        title: "API GW Request Status Graph Live",
        view: GraphWidgetView.TIME_SERIES,
        width: 24,
        liveData: true,
        leftYAxis: { showUnits: true },

        left: [
          new Metric({
            metricName: metricName,
            namespace: metricNamespace,
            statistic: metricStatistic,
            label: metricDimensionFilter.Success.label,
            period: Duration.minutes(5),
            unit: metricUnits,
            color: Color.GREEN,
            dimensionsMap: metricDimensionFilter.Success.DimensionMap,
          }),
        ],
        right: [
          new Metric({
            metricName: metricName,
            namespace: metricNamespace,
            statistic: metricStatistic,
            label: metricDimensionFilter.Forbidden.label,
            period: Duration.minutes(5),
            unit: metricUnits,
            color: Color.ORANGE,
            dimensionsMap: metricDimensionFilter.Forbidden.DimensionMap,
          }),
        ],
        legendPosition: LegendPosition.BOTTOM,
      })
    );
AlarmWidget 🩺
You can as well add an alarm widget to this dashboard as follows.
dashboard.addWidgets(
      new AlarmWidget({
        title: "Forbidden Requests High Alert",
        alarm: alarm,
        width: 24,
        leftYAxis: { showUnits: true },
      })
    );
onDestroy 💣
Usually, in every resource, I deploy using CDK, I make sure I destroy it once the deployment is no longer needed after the demo. Hence I add an applyRemovalPolicy logic and tag to those resources.
dashboard.applyRemovalPolicy(RemovalPolicy.DESTROY);
Thus we have achieved our objectives in extracting metrics from a log group provided, triggering an alarm, and setting our custom dashboard using CDK with the graph and alarm widgets.
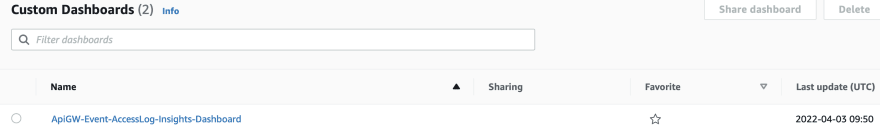
View Dashboard 💯
Alarm Widget changes 💫

We will be adding more connections to this API gateway and lambda stack and make it more usable in the upcoming articles by creating a new construct, so do consider following and subscribing to my newsletter.
⏭ We have our next article in serverless, do check out
🎉 Thanks for supporting! 🙏
Would be great if you like to ☕ Buy Me a Coffee, to help boost my efforts.


🔁 Original post at 🔗 Dev Post
🔁 Reposted at 🔗 dev to @aravindvcyber
🎠 AWS CDK 101 - 🚄 Cloudwatch Metrics Filter with Dimensions and Alarms connected to ChatOps#awscdk #aws #serverless #typescript #dashboard https://t.co/5KHozRxMEq
— Aravind V (@Aravind_V7) April 3, 2022

Top comments (0)