
What will be scraped

Why using API?
- No need to create a parser from scratch and maintain it.
- Bypass blocks from Google: solve CAPTCHA or solve IP blocks.
- Pay for proxies, and CAPTCHA solvers.
- Don't need to use browser automation.
SerpApi handles everything on the backend with fast response times under ~2.5 seconds (~1.2 seconds with Ludicrous speed) per request and without browser automation, which becomes much faster. Response times and status rates are shown under SerpApi Status page.

Full Code
If you don't need explanation, have a look at full code example in the online IDE.
from serpapi import GoogleSearch
import matplotlib.pyplot as plt
import pandas as pd
import seaborn as sns
import os, json

params = {
    # https://docs.python.org/3/library/os.html#os.getenv
    'api_key': os.getenv('API_KEY'),        # your serpapi api
    'engine': 'google_trends',              # SerpApi search engine
    'date': 'today 12-m',                   # by default Past 12 months
    'cat': 0,                               # by default All categories
    # 'geo': '',                            # by default Worldwide
    # 'gprop': 'images',                    # by default Web Search
    # 'data_type': '',                      # type of search (defined in the function)
    # 'q': '',                              # query (defined in the function)
}


def scrape_google_trends(data_type: str, key: str, query: str):
    params['data_type'] = data_type
    params['q'] = query

    search = GoogleSearch(params)           # where data extraction happens on the SerpApi backend
    results = search.get_dict()             # JSON -> Python dict

    return results[key] if not results['error'] else results['error']


def get_all_data():
    data = {
        'interest_over_time': {},
        'compared_breakdown_by_region': [],
        'interest_by_region': [],
        'related_topics': {},
        'related_queries': {}
    }

    interest_over_time = scrape_google_trends('TIMESERIES', 'interest_over_time', 'Mercedes,BMW,Audi')
    data['interest_over_time'] = interest_over_time

    compared_breakdown_by_region = scrape_google_trends('GEO_MAP', 'compared_breakdown_by_region', 'Mercedes,BMW,Audi')
    data['compared_breakdown_by_region'] = compared_breakdown_by_region

    interest_by_region = scrape_google_trends('GEO_MAP_0', 'interest_by_region', 'Mercedes')
    data['interest_by_region'] = interest_by_region

    related_topics = scrape_google_trends('RELATED_TOPICS', 'related_topics', 'Mercedes')
    data['related_topics'] = related_topics

    related_queries = scrape_google_trends('RELATED_QUERIES', 'related_queries', 'Mercedes')
    data['related_queries'] = related_queries

    return data


def plot_interest_over_time(data: dict):
    timeseries = []

    # Extracting data
    for result in data['interest_over_time']['timeline_data']:
        for value in result['values']:
            query = value['query']
            extracted_value = value['extracted_value']

            timeseries.append({
                'timestamp': result['timestamp'],
                'query': query,
                'extracted_value': extracted_value,
            })

    # Plotting data
    df = pd.DataFrame(data=timeseries)

    sns.set(rc={'figure.figsize': (13, 5)})
    palette = sns.color_palette('mako_r', 3)  # 3 is number of colors

    ax = sns.lineplot(
        data=df,
        x='timestamp',
        y='extracted_value',
        hue='query',
        palette=palette,
    )

    plt.legend(bbox_to_anchor=(1.01, 1), loc='upper left', borderaxespad=0)
    ax.set(xticklabels=[])
    ax.set(xlabel='')

    plt.show()


if __name__ == "__main__":
    google_trends_result = get_all_data()
    print(json.dumps(google_trends_result, indent=2, ensure_ascii=False))
    plot_interest_over_time(google_trends_result)
Preparation
Install library:
pip install google-search-results matplotlib pandas seaborn
google-search-results is a SerpApi API package.
Code Explanation
Import libraries:
from serpapi import GoogleSearch
import os, json
import matplotlib.pyplot as plt
import pandas as pd
import seaborn as sns
| Library | Purpose |
|---|---|
GoogleSearch |
to scrape and parse Google results using SerpApi web scraping library. |
os |
to return environment variable (SerpApi API key) value. |
json |
to convert extracted data to a JSON object. |
matplotlib.pyplot |
to provide a state-based interface to matplotlib. It provides an implicit, MATLAB-like, way of plotting. It also opens figures on your screen and acts as the figure GUI manager. |
pandas |
to provide high-performance, easy-to-use data structures and data analysis tools. |
seaborn |
to provide a high-level interface for drawing attractive and informative statistical graphics. |
Next, we write a parameters for making a request:
params = {
    # https://docs.python.org/3/library/os.html#os.getenv
    'api_key': os.getenv('API_KEY'),        # your serpapi api
    'engine': 'google_trends',              # SerpApi search engine
    'date': 'today 12-m',                   # by default Past 12 months
    'cat': 0,                               # by default All categories
    # 'geo': '',                            # by default Worldwide
    # 'gprop': 'images',                    # by default Web Search
    # 'data_type': '',                      # type of search (defined in the function)
    # 'q': '',                              # query (defined in the function)
}
| Parameters | Explanation |
|---|---|
api_key |
Parameter defines the SerpApi private key to use. |
engine |
Set parameter to google_trends to use the Google Trends API engine. |
date |
Parameter is used to define a date (e.g. today 12-m - Past 12 months). |
cat |
Parameter is used to define a search category. The default value is set to 0 ("All categories"). Head to the Google Trends Categories for a full list of supported Google Trends Categories. |
geo |
Parameter defines the location from where you want the search to originate. It defaults to Worldwide (activated when the value of geo parameter is not set or empty). Head to the Google Trends Locations for a full list of supported Google Trends locations. |
gprop |
Parameter is used for sorting results by property. The default property is set to Web Search (activated when the value of gprop parameter is not set or empty). |
data_type |
Parameter defines the type of search you want to do. |
q |
Parameter defines the query or queries you want to search. |
Scrape Google Trends
This function returns part of the requested data. It also takes the following 3 parameters:
-
data_type- the value of the corresponding parameter, which defines the type of search. -
key- the key by which the required data is found. -
query- the value of anything that you would use in a regular Google Trends search.
The parameters for the current request are determined:
params['data_type'] = data_type
params['q'] = query
We then create a search object where the data is retrieved from the SerpApi backend. In the result_dict dictionary we get data from JSON:
search = GoogleSearch(params)   # where data extraction happens on the SerpApi backend
results = search.get_dict()     # JSON -> Python dict
At the end of the function, you need to return the data that is located by the passed key, if any:
return results[key] if not results['error'] else results['error']
The complete function to scrape Google Trends would look like this:
def scrape_google_trends(data_type: str, key: str, query: str):
    params['data_type'] = data_type
    params['q'] = query

    search = GoogleSearch(params)   # where data extraction happens on the SerpApi backend
    results = search.get_dict()     # JSON -> Python dict

    return results[key] if 'error' not in results else results['error']
Get all data
This function returns a list with all data.
At the beginning of the function, you must declare the structure of the data list, which will store all the data:
data = {
    'interest_over_time': {},
    'compared_breakdown_by_region': [],
    'interest_by_region': [],
    'related_topics': {},
    'related_queries': {}
}
For each chart, you need to get a piece of data by calling the scrape_google_trends(<data_type>, <key>, <query>) function with the appropriate parameters. Then all this data is added to the data list:
interest_over_time = scrape_google_trends('TIMESERIES', 'interest_over_time', 'Mercedes,BMW,Audi')
data['interest_over_time'] = interest_over_time

compared_breakdown_by_region = scrape_google_trends('GEO_MAP', 'compared_breakdown_by_region', 'Mercedes,BMW,Audi')
data['compared_breakdown_by_region'] = compared_breakdown_by_region

interest_by_region = scrape_google_trends('GEO_MAP_0', 'interest_by_region', 'Mercedes')
data['interest_by_region'] = interest_by_region

related_topics = scrape_google_trends('RELATED_TOPICS', 'related_topics', 'Mercedes')
data['related_topics'] = related_topics

related_queries = scrape_google_trends('RELATED_QUERIES', 'related_queries', 'Mercedes')
data['related_queries'] = related_queries
| Chart | data_type | key | query |
|---|---|---|---|
| Interest over time (default) | TIMESERIES |
interest_over_time |
Accepts both single and multiple queries per search. |
| Compared breakdown by region | GEO_MAP |
compared_breakdown_by_region |
Accepts only multiple queries per search. |
| Interest by region | GEO_MAP_0 |
interest_by_region |
Accepts only single query per search. |
| Related topics | RELATED_TOPICS |
related_topics |
Accepts only single query per search. |
| Related queries | RELATED_QUERIES |
related_queries |
Accepts only single query per search. |
The maximum number of queries per search is 5 (this only applies to "Interest over time" and "Compared breakdown by region" data_type, other types of data will only accept 1 query per search).
When passing multiple queries you need to use a comma (,) to separate them (e.g. Mercedes,BMW,Audi).
At the end of the function, you need to return data:
return data
The complete function to get all data would look like this:
def get_all_data():
    data = {
        'interest_over_time': {},
        'compared_breakdown_by_region': [],
        'interest_by_region': [],
        'related_topics': {},
        'related_queries': {}
    }

    interest_over_time = scrape_google_trends('TIMESERIES', 'interest_over_time', 'Mercedes,BMW,Audi')
    data['interest_over_time'] = interest_over_time

    compared_breakdown_by_region = scrape_google_trends('GEO_MAP', 'compared_breakdown_by_region', 'Mercedes,BMW,Audi')
    data['compared_breakdown_by_region'] = compared_breakdown_by_region

    interest_by_region = scrape_google_trends('GEO_MAP_0', 'interest_by_region', 'Mercedes')
    data['interest_by_region'] = interest_by_region

    related_topics = scrape_google_trends('RELATED_TOPICS', 'related_topics', 'Mercedes')
    data['related_topics'] = related_topics

    related_queries = scrape_google_trends('RELATED_QUERIES', 'related_queries', 'Mercedes')
    data['related_queries'] = related_queries

    return data
Plot interest over time
This function takes a dictionary with the retrieved data and returns a graph based on the Interest over time chart.
At the beginning of the function, you must declare a timeseries list and fill it with the necessary data for plotting:
timeseries = []

# Extracting data
for result in data['interest_over_time']['timeline_data']:
    for value in result['values']:
        query = value['query']
        extracted_value = value['extracted_value']

        timeseries.append({
            'timestamp': result['timestamp'],
            'query': query,
            'extracted_value': extracted_value,
        })
The next step is to plot the graph:
# Plotting data
df = pd.DataFrame(data=timeseries)

sns.set(rc={'figure.figsize': (13, 5)})
palette = sns.color_palette('mako_r', 3)  # 3 is number of colors

ax = sns.lineplot(
    data=df,
    x='timestamp',
    y='extracted_value',
    hue='query',
    palette=palette,
)

plt.legend(bbox_to_anchor=(1.01, 1), loc='upper left', borderaxespad=0)
ax.set(xticklabels=[])
ax.set(xlabel='')

plt.show()
The complete function to show all interest over time would look like this:
def plot_interest_over_time(data: dict):
    timeseries = []

    # Extracting data
    for result in data['interest_over_time']['timeline_data']:
        for value in result['values']:
            query = value['query']
            extracted_value = value['extracted_value']

            timeseries.append({
                'timestamp': result['timestamp'],
                'query': query,
                'extracted_value': extracted_value,
            })

    # Plotting data
    df = pd.DataFrame(data=timeseries)

    sns.set(rc={'figure.figsize': (13, 5)})
    palette = sns.color_palette('mako_r', 3)  # 3 is number of colors

    ax = sns.lineplot(
        data=df,
        x='timestamp',
        y='extracted_value',
        hue='query',
        palette=palette,
    )

    plt.legend(bbox_to_anchor=(1.01, 1), loc='upper left', borderaxespad=0)
    ax.set(xticklabels=[])
    ax.set(xlabel='')

    plt.show()
To demonstrate how the function works, the following parameters were passed and the corresponding data was generated:
params = {
    'date': 'all',                  # 2004 - present
    'q': 'london,new york,brazil',  # query
}
The result of the function is below:
| Google Trends |
|---|
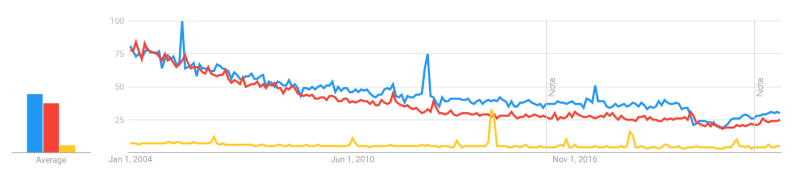 |
| Resulted graph |
|---|
 |
Top-level code environment
The last step would be to add a Python idiom to make sure that readers understand this code as an executable script. Inside we call the get_all_data() function and print the received data:
if __name__ == "__main__":
    google_trends_result = get_all_data()
    print(json.dumps(google_trends_result, indent=2, ensure_ascii=False))
    # plot_interest_over_time(google_trends_result)
Output
{
  "interest_over_time": {
    "timeline_data": [
      {
        "date": "Oct 24 – 30, 2021",
        "values": [
          {
            "query": "Mercedes",
            "value": "56",
            "extracted_value": 56
          },
          {
            "query": "BMW",
            "value": "80",
            "extracted_value": 80
          },
          {
            "query": "Audi",
            "value": "43",
            "extracted_value": 43
          }
        ]
      },
      ... other results
      {
        "date": "Oct 16 – 22, 2022",
        "values": [
          {
            "query": "Mercedes",
            "value": "52",
            "extracted_value": 52
          },
          {
            "query": "BMW",
            "value": "75",
            "extracted_value": 75
          },
          {
            "query": "Audi",
            "value": "40",
            "extracted_value": 40
          }
        ]
      }
    ],
    "averages": [
      {
        "query": "Mercedes",
        "value": 55
      },
      {
        "query": "BMW",
        "value": 82
      },
      {
        "query": "Audi",
        "value": 43
      }
    ]
  },
  "compared_breakdown_by_region": "Google Trends hasn't returned any results for this query.",
  "interest_by_region": [
    {
      "geo": "AL",
      "location": "Albania",
      "max_value_index": 0,
      "value": "100",
      "extracted_value": 100
    },
    ... other results
    {
      "geo": "TH",
      "location": "Thailand",
      "max_value_index": 0,
      "value": "4",
      "extracted_value": 4
    }
  ],
  "related_topics": "Google Trends hasn't returned any results for this query.",
  "related_queries": "Google Trends hasn't returned any results for this query."
}
Links
- Code in the online IDE
- Google Trends API
- Google Trends Interest Over Time API
- Google Trends Compared Breakdown By Region API
- Google Trends Interest By Region API
- Google Trends Related Topics API
- Google Trends Related Queries API
Add a Feature Request💫 or a Bug🐞

Top comments (0)