This is a post to share my findings on how to set up VS Code to debug a standalone Blazor WebAssembly application with hot reload. The journey to a successful setup starts here: Debug ASP.NET Core Blazor WebAssembly. Except hot reload is not covered and debugging itself doesn't work 100% out of the box. After a lot of research (example) I had doubts there was support of hot reload with debugging using VS Code. Luckily with some simple tweaking we can have our Blazor WASM debugging and hot reload it too!
The gist
See source for Blazor WASM project set up for hot reload. The following modifications to a new blazorwasm project are required:
- Disable
launchBrowserinlaunchSettings.json - Add launch configuration to run and watch site using
dotnet watch - Add launch configuration to attach Blazor debug proxy to site
- Use a compound to launch both of the new configurations
- Enforce the
dotnet watchscript if hot reload fails (see documentation)
You can see debug and hot reload in action below.
NOTE: In this demonstration I'm not using HTTPS, but I have tested that debugging with hot reload indeed works with HTTPS.
The journey
My setup at the start of this:
- Windows 10
- dotnet 6.0.101
- VS Code 1.63.2
- Chrome 96.0.4664.110 (Official Build) (64-bit)
- Microsoft Edge 96.0.1054.62 (Official build) (64-bit)
NOTE: I have had success debugging with hot reload using both Chrome and Edge. Firefox is not supported by the VS Code Blazor WASM extension.
Let's square away the required VS Code extensions first. Open VS Code and install the following extensions and restart VS Code when done. This benefits us so that we get the Blazor debug setup prompt later.
- ms-dotnettools.csharp (v1.23.17)
- ms-dotnettools.blazorwasm-companion (v1.1.0)
Make an empty directory, say blazorwasm. Inside the directory run dotnet new blazorwasm. Now open VS Code in this directory. Give VS Code some time to initialize and you should be prompted to finish setting up Blazor for your project.
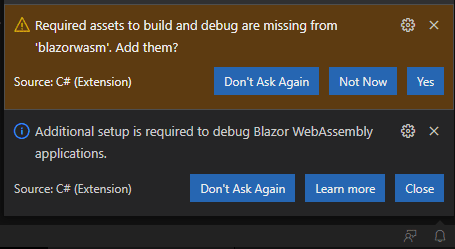
I noticed the "Additional setup is required to debug Blazor WebAssembly applications" persists to pop-up even after following Microsoft guidelines for setting up VS Code for Blazor projects. The prompt "Required assets to build and debug are missing from..." is the one we want to click "Yes". This adds the tasks.json and launch.json files in .vscode directory so that we can build and debug the Blazor project. We'll only be concerned with the launch.json.
{
    "version": "0.2.0",
    "configurations": [
        {
            "name": "Launch and Debug Standalone Blazor WebAssembly App",
            "type": "blazorwasm",
            "request": "launch",
            "cwd": "${workspaceFolder}"
        }
    ]
}
Simply hitting F5 at this point launches a Chrome browser that fails to connect to the site and closes without any indicator (at least on my machine). This is most likely due to the launch configuration not knowing what URL to hit. Add the URL defined in the properties/launchSettings.json to the launch.json:
{
    "version": "0.2.0",
    "configurations": [
        {
            "name": "Launch and Debug Standalone Blazor WebAssembly App",
            "type": "blazorwasm",
            "request": "launch",
            "cwd": "${workspaceFolder}",
            "url": "https://localhost:7021" // Tell launch where to find site
        }
    ]
}
We can now successfully launch the debug session and demonstrate breakpoints being hit in Razor files within VS Code. Now let's get Hot Reload working! Add launch configurations for a dotnet watch command and a blazorwasm attach. Finally create a compound that debugs both of the new launch configurations.
{
    "version": "0.2.0",
    "configurations": [
        {
            "name": "Launch and Debug Standalone Blazor WebAssembly App",
            "type": "blazorwasm",
            "request": "launch",
            "cwd": "${workspaceFolder}",
            "url": "https://localhost:7021" // Tell launch where to find site
        },
        {
            "name": "Watch",
            "type": "coreclr",
            "request": "launch",
            "cwd": "${workspaceFolder}",
            "program": "dotnet",
            "args": [
                "watch",
                "--project",
                ".",
                "--verbose" // Let's us confirm browser connects with hot reload capabilities
            ],
            "preLaunchTask": "build" // Ensure we don't watch an unbuilt site
        },
        {
            "name": "Attach",
            "type": "blazorwasm",
            "request": "attach",
            "cwd": "${workspaceFolder}",
            "url": "https://localhost:7021",  // Tell launch where to find site
            "timeout": 120000, // Allows time for the site to launch
        }
    ],
    "compounds": [
        {
            "name": "Debug with Hot Reload",
            "configurations": [ "Watch", "Attach" ]
        }
    ]
}
Before starting the Debug with Hot Reload configuration, set the launchBrowser property to false in the properties/launchSettings.json file. Otherwise, the dotnet watch command will launch another browser for the Blazor site. If hot reload is working successfully, then you should see the following log in the Watch debug console when the browser connects to the site:
watch : Hot reload capabilities: Baseline.
If you do not see this logged, then try the following steps:
- Make changes to a Razor file and save it
- Refresh the browser manually
- Make more changes to the same Razor file and save it again.
- Repeat step 3.
You should now have noticed the Watch debug console has indicated hot reload has taken place and the site reflects the changes. In some cases I've had to repeat steps 1-4 multiple times. What I learned is that the required JavaScript file for hot reload does not always load on first connection to the site (see documentation). We can enforce this by adding the following snippet to the body tag in the index.html file.
<environment names="Development">
    <script src="_framework/aspnetcore-browser-refresh.js"></script>
</environment>
Final thoughts
This is my first time attempting to use Blazor WASM. I'm quite surprised at the information available for getting a development environment set up compared to similar technologies. I hope this post finds and helps those searching on how to set up a reasonable development environment.


Top comments (2)
Hi there! Excelente article Im using all the tricks you mentioned and works great! Only one thing is getting me mad sometimes when you have the chrome dev tools opened the debugger crash and close chrome window. I think is because of some breakpoints that make the debugger reaches the timeout threhold and then try to reload the app. Did it happen to anyone? Any fix or work around? Appreciate! Best regards.
Hi Steven!
Have you managed to get this working on a Blazor Wasm + .net core Hosted project?
What you shared works perfectly fine, but I'm struggling to achieve the same in a hosted model project.
Thanks