In my last article, we have seen JMeter Integration with InfluxDB and Grafana using Docker. We have used InfluxDB 1.8.3. This article talks about JMeter Integration with InfluxDB 2.0, because its little tricky in JMeter.
What's new in InfluxDB 2.0?
InfluxDB 2.0 Open Source is GA last month (November 2020). InfluxDB 2.0 contains single binary to get started, and its secure by default, meaning every request accompanied by a token, new query language Flux and more.
Prerequisites
- Docker
- Apache JMeter 5.4
As usual, this setup has been tested in Windows 10 Pro. But it should work in other OS as well.
Let's get started
InfluxDB 2.0 Set up
You cannot install InfluxDB 2.0 natively in Windows OS. You must rely on Docker (at this moment of writing). To spin up InfluxDB 2.0 container, use the below command.
docker run -d -p 9002:8086 quay.io/influxdb/influxdb:v2.0.3We are spinning up the container in the detached mode in the port 9002.
Launch http://localhost:9002 in your favorite browser.
Set up the initial user by filling the username, organization, and initial bucket name and then click on Continue. This will create a new bucket jmeter.

Congratulations on spinning up InfluxDB 2.0.
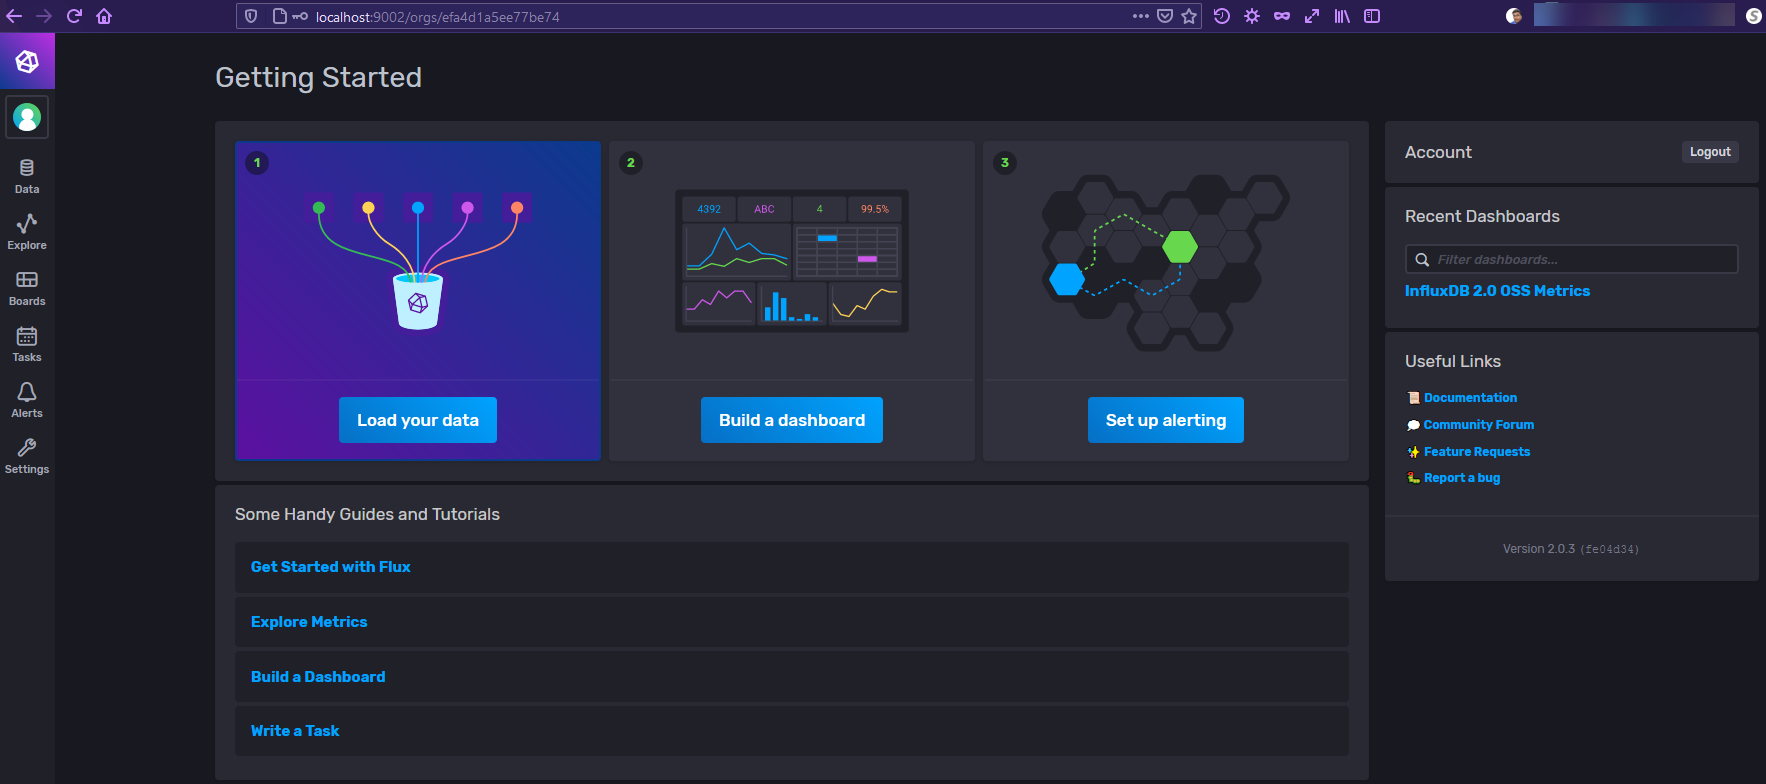
To integrate with JMeter, we need to token. Navigate to Data > Tokens, click on Generate > Read/Write Token as shown below.

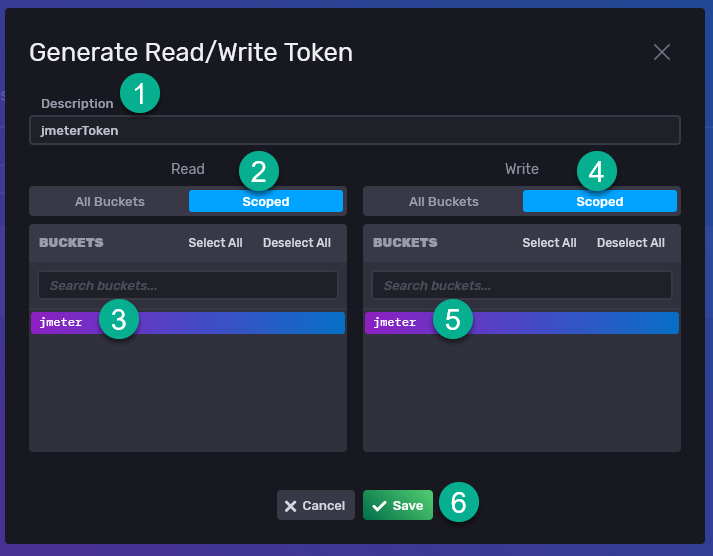
Enter the description, select the scope for the bucket jmeter and then click on Save.
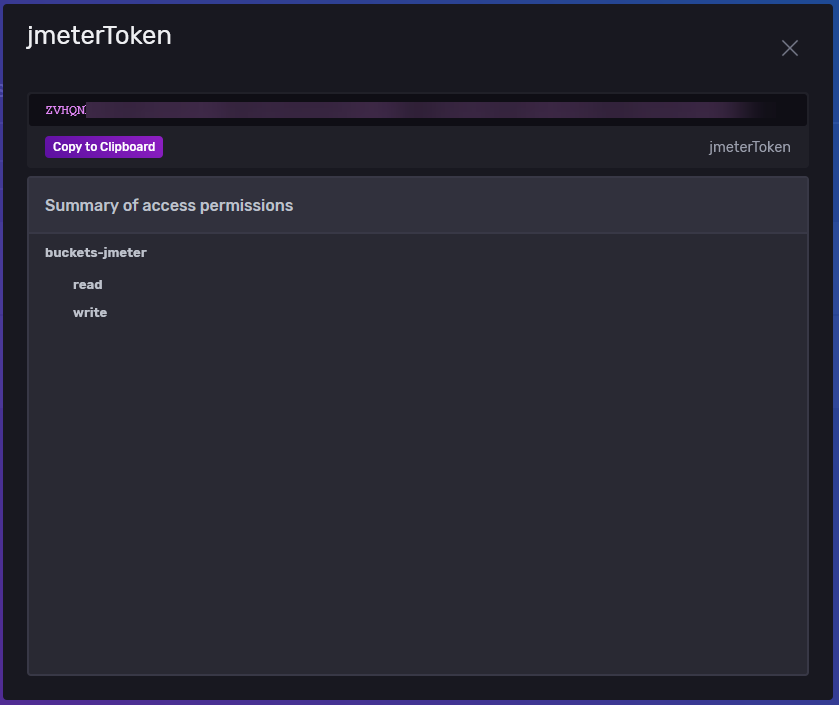
Click on the token name to copy the generated token.
JMeter Set up
Launch JMeter, and open the test plan which you will be executing. Add a backend listener by right clicking on Thread Group > Add > Listener > Backend Listener.
In this integration we are going to select InfluxDBRawBackendListenerClient. This is one of the JMeter 5.4 feature.

InfluxDBRawBackendListenerClient uses more resources both in JMeter and InfluxDB as it streams all the results to InfluxDB.
Below are the parameters that needs to be configured.

- influxdbMetricsSender as org.apache.jmeter.visualizers.backend.influxdb.HttpMetricsSender
- influxdbUrl as http://localhost:9002/api/v2/write?org=qainsights&bucket=jmeter
- influxdbToken as the value copied from InfluxDB
- measurement as jmeter (see Line Protocol)
Save your test plan and start your JMeter test in CLI mode.
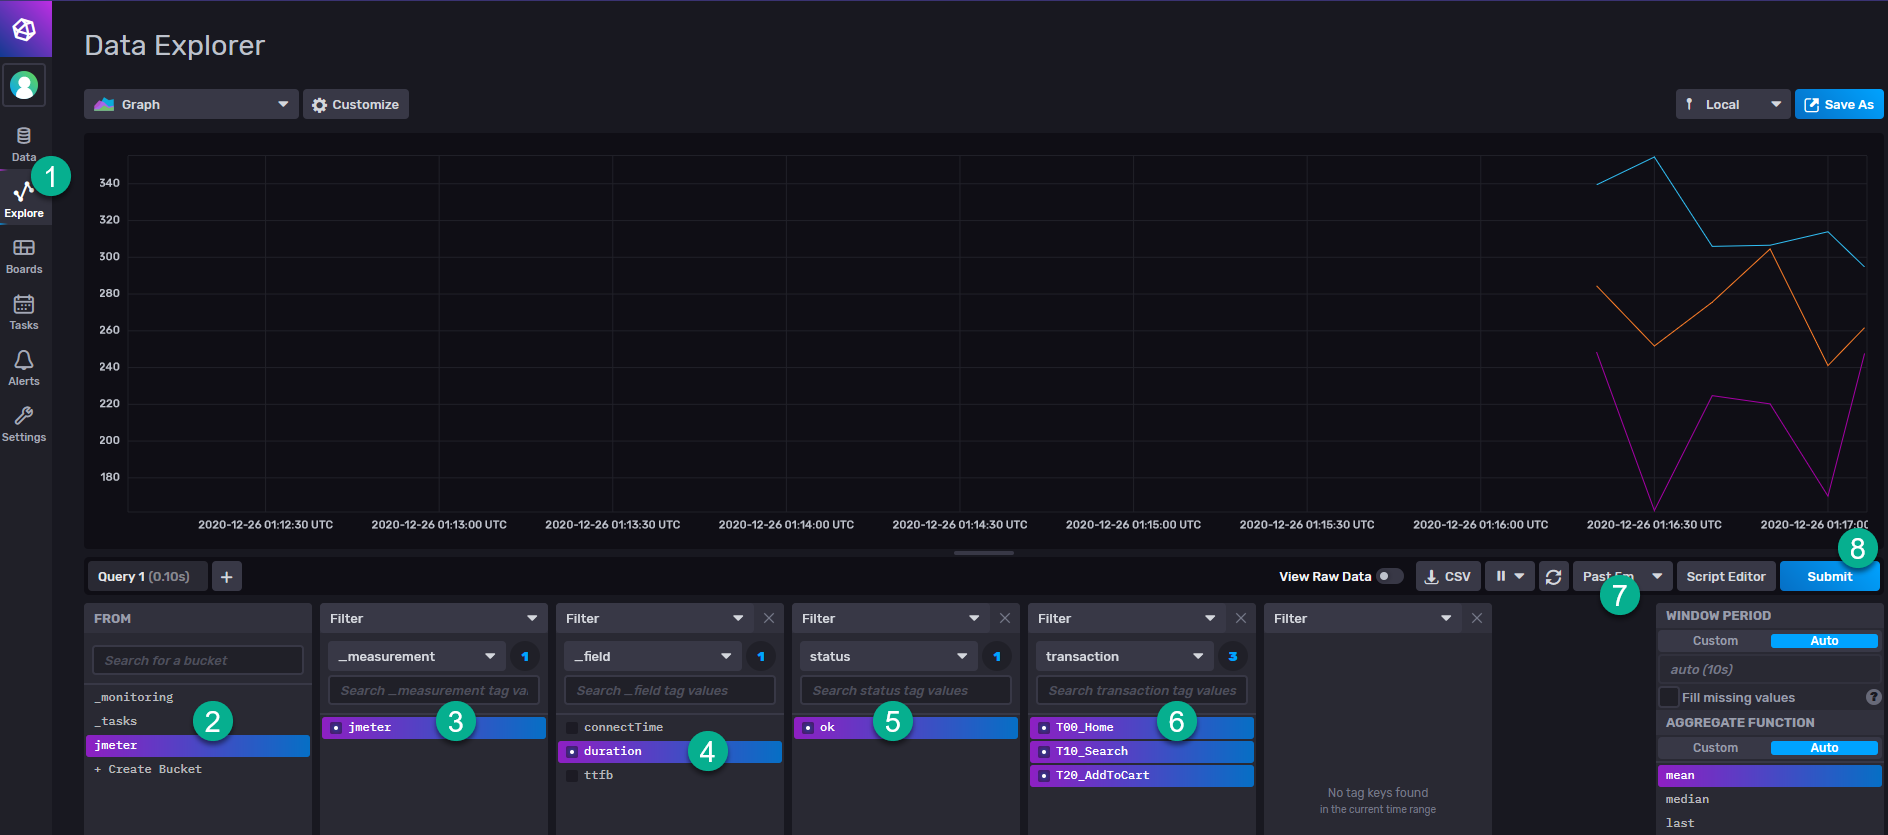
Go to Influx and navigate to Data Explorer. You could see your JMeter performance stats real time.
Below is the configuration if you would like to use the Backend Listener Client. Please make sure that you have added influxdbToken.
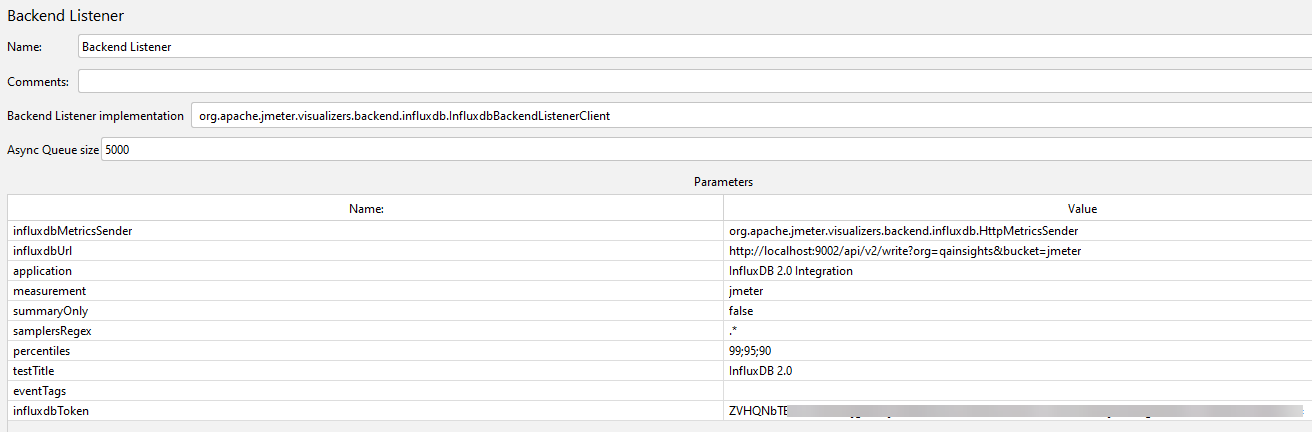
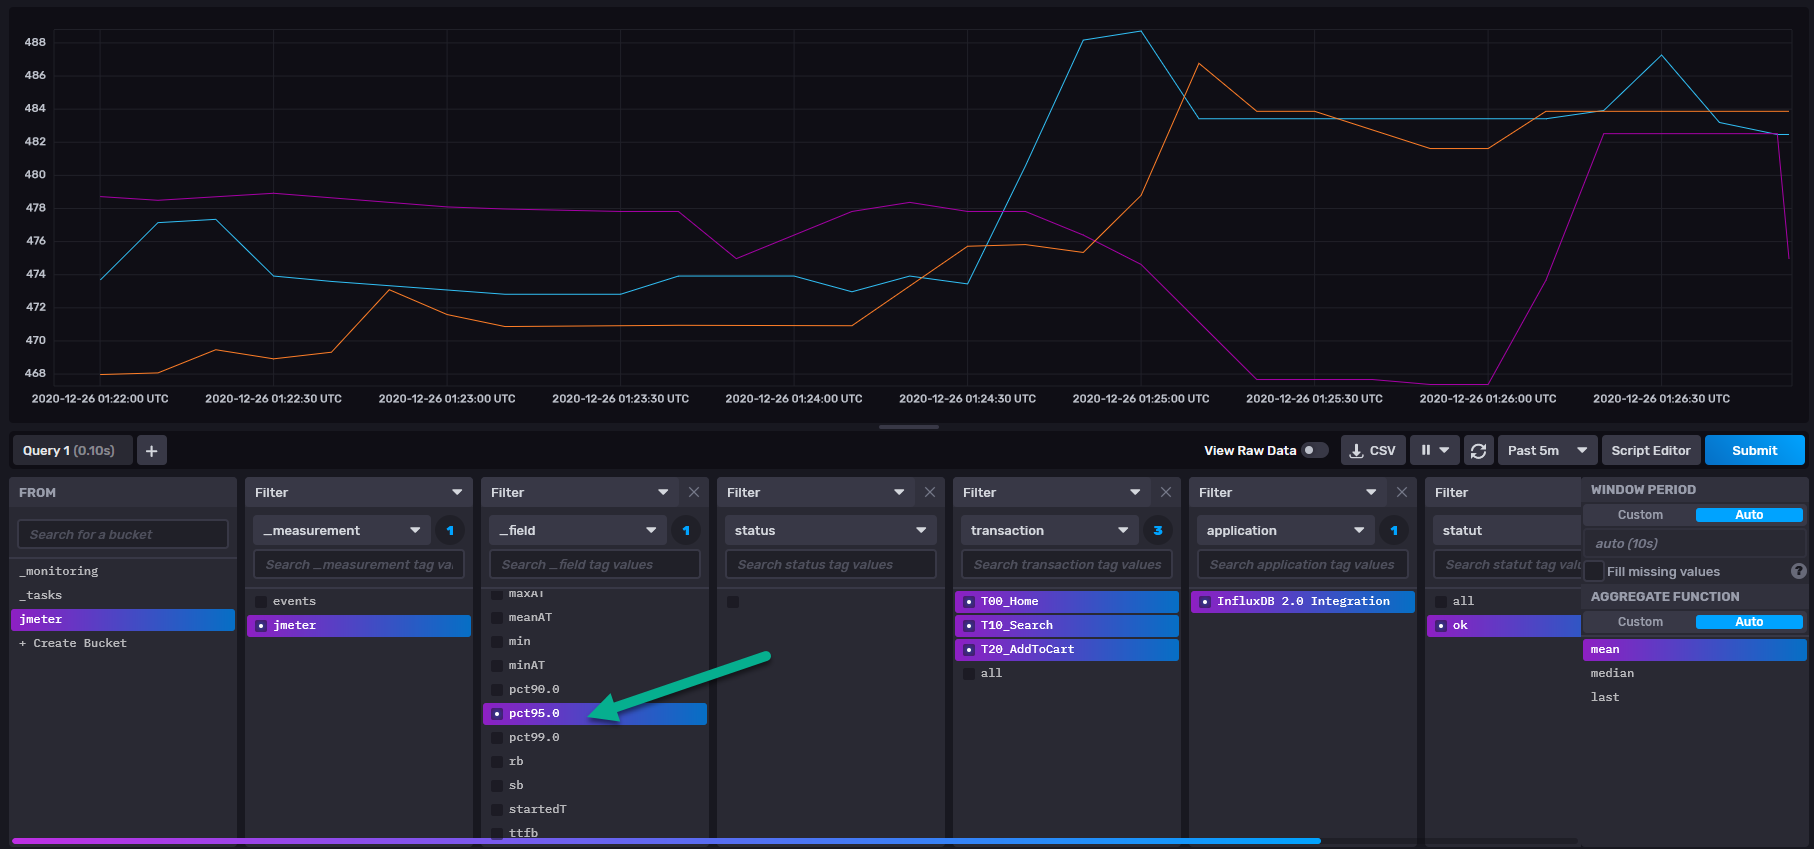
For the above configuration , you will get percentile measurements in InfluxDB.
Grafana Integration
If you do not want to use InfluxDB 2.0 visualization, you can integrate in Grafana. Launch Grafana and navigate to Data Sources. Check my last post about how to add Data Source in Grafana.
In the Data Sources page, configure the below settings.

The difference between Influx 1.8.3 vs Influx 2.0 set up is: the Query Language and Connection details.
Please make sure you select Flux as Query Language and the connection is the docker container IP address.
To read the docker container IP address, enter the below command.
docker container inspect <container_id> | grep -i ipaddresscontainer_id is the influx db container ID.
The default port of InfluxDB is 8086.
Also, make sure you are configuring the Token.
Click on Save & Test which will retrieve the bucket(s).
Navigate to Explore and select the database and enter the below query and hit Run Query.
from(bucket: "jmeter")
  |> range(start: v.timeRangeStart, stop: v.timeRangeStop)
  |> filter(fn: (r) => r["_measurement"] == "jmeter")
  |> filter(fn: (r) => r["_field"] == "pct95.0")
  |> filter(fn: (r) => r["transaction"] == "T00_Home" or r["transaction"] == "T10_Search" or r["transaction"] == "T20_AddToCart")
  |> filter(fn: (r) => r["application"] == "InfluxDB 2.0 Integration")
  |> filter(fn: (r) => r["statut"] == "ok")
  |> aggregateWindow(every: v.windowPeriod, fn: mean, createEmpty: false)
  |> yield(name: "mean")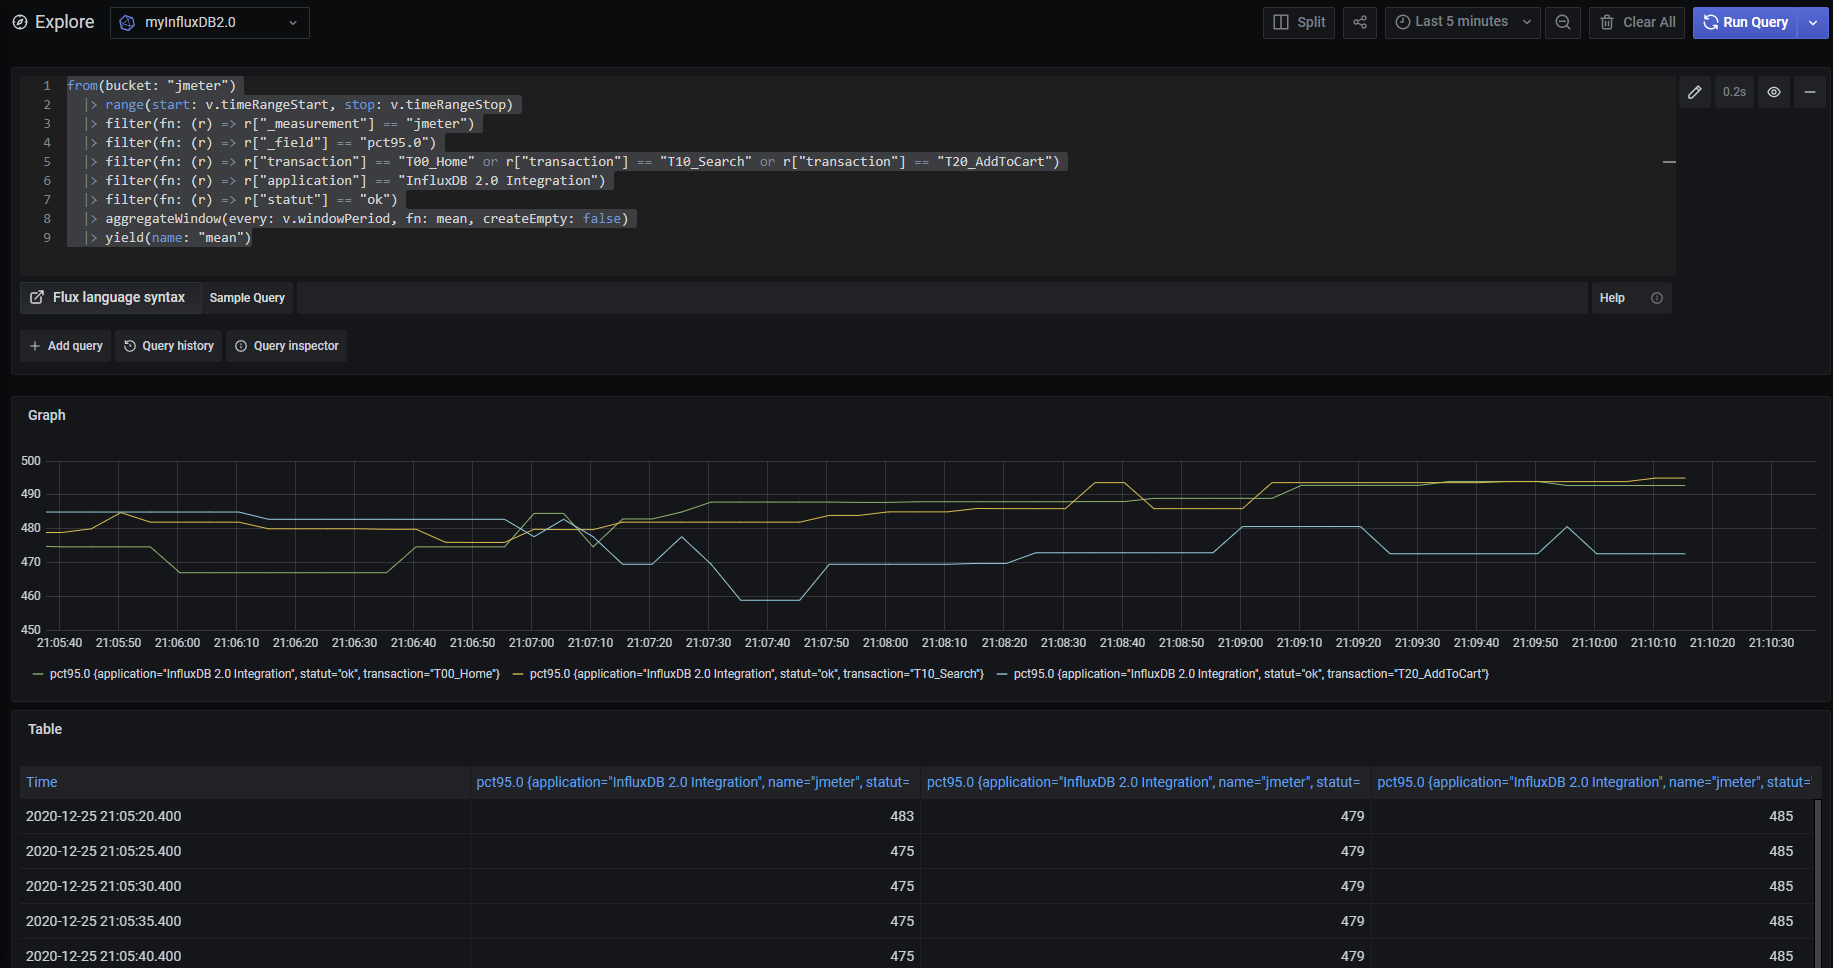
Final Words
InfluxDB 2.0 integration with JMeter powers up your performance test monitoring to the next level. By having powerful dashboards and monitoring them while the test is running helps you to debug the issues quicker.
The JMeter help documentation instructions didn't help me in integrating InfluxDB 2.0. But the above configuration makes the integration easy.


Top comments (0)