
In this blog post you will learn how to get started with browser performance testing using k6. Client-side performance is paramount to validate the performance of your application along with the network load i.e. protocol load e.g. APIs. Not many tools are sophisticated when it comes to measuring end-to-end performance. Opentext LoadRunner TruClient protocol is one of the tool at its best when it comes to measuring front-end performance.
JMeter w/ Selenium can be used to measure the browser performance. But the maintenance is nightmare and too flaky. If you do not want to use any tool, you can leverage the Chromium Developer Protocol.
What is Chromium Developer Protocol?
It is often referred to as the Chrome DevTools Protocol (CDP), is a set of APIs and tools that allow developers to interact with and inspect web pages in the Chromium-based web browsers like Google Chrome, Microsoft Edge, and others. It provides a way to access and control various aspects of web pages, such as inspecting the Document Object Model (DOM), manipulating CSS, monitoring network activity, debugging JavaScript, and much more.
Getting Started with k6 browser
k6 is getting traction among developers and performance engineers. After getting acquired to Grafana, there are numerous improvements in the k6 ecosystem. I have already published a complete series on k6, please check it out if you are new to k6.
https://www.youtube.com/playlist?list=PLJ9A48W0kpRJKmVeurt7ltKfrOdr8ZBdt
No more building xk6 browser from the binaries. The latest version of k6 is now bundled with the browser capability to test the front-end performance.
The following are the prerequisites to get started with k6 browser:
- the latest version of k6
- Chrome browser in your local
You can install k6 in Windows, Linux, and macOS. Here is the command to install k6 in Mac.
brew install k6
To verify the installation, use k6 version.
k6 browser is built on top of Playwright API. Playwright is an open-source automation library for browsers that allows developers and testers to automate tasks and interactions with web pages in Chromium, Firefox, and WebKit-based browsers.
It provides a JavaScript API that makes it easy to write browser automation scripts and run them across different browser engines. Playwright is developed by Microsoft and is designed to be a more powerful and user-friendly alternative to other browser automation libraries like Puppeteer.
Hello, Browser in k6 browser
Copy and paste the below code and save it as hello-browser.js.
import { browser } from 'k6/experimental/browser';

export const options = {
  scenarios: {
    ui: {
      executor: 'shared-iterations',
      options: {
        browser: {
          type: 'chromium',
        },
      },
    },
  },
  thresholds: {
    checks: ["rate==1.0"]
  }
}

export default async function () {
  const page = browser.newPage();

  try {
    await page.goto('https://example.com');
  } finally {
    page.close();
  }
}
To run the script, k6 run hello-browser.js
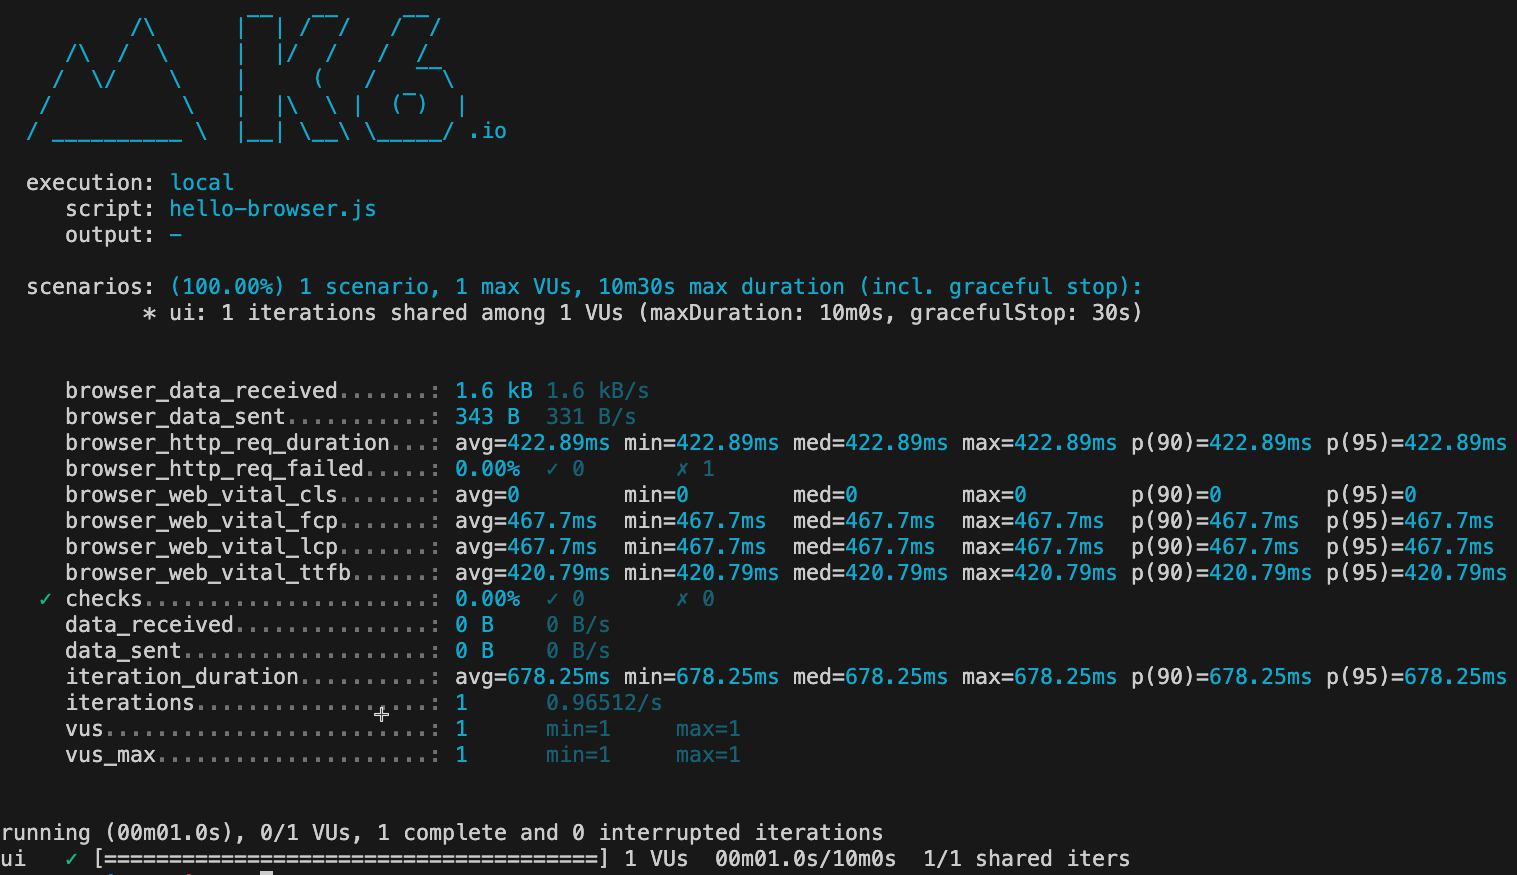
Here is the output.
Let us break down the code one by one.
- Import the
browserobject from thek6/experimental/browsermodule. This object is used to interact with web pages in your performance test. - Define the
optionsobject, which specifies the configuration for the k6 test.-
scenarios: This section defines different test scenarios. In this case, there is only one scenario named "ui."-
executor: It specifies the execution mode for the scenario, which is set to "shared-iterations." In this mode, virtual users share a fixed number of iterations. -
options: Further options for the scenario, including the type of browser to be used. Here, it's set to "chromium," indicating the Chromium browser.
-
-
thresholds: This section defines the criteria for passing or failing the test.-
checks: It specifies a threshold for a check named "rate," which is set to 1.0. This means that all checks in the test should have a success rate of 100% for the test to pass.
-
-
- Export a default asynchronous function. This function will be executed by k6 during the performance test.
- Inside the function, a new page is created using
browser.newPage(). This represents a virtual user's interaction with a web page. - Within a
tryblock, the virtual user navigates to the URL 'https://example.com' usingpage.goto(). This simulates a user visiting the specified web page. - In the
finallyblock, thepageis closed usingpage.close(). This ensures that resources are properly cleaned up after the virtual user has finished interacting with the web page.
- Inside the function, a new page is created using
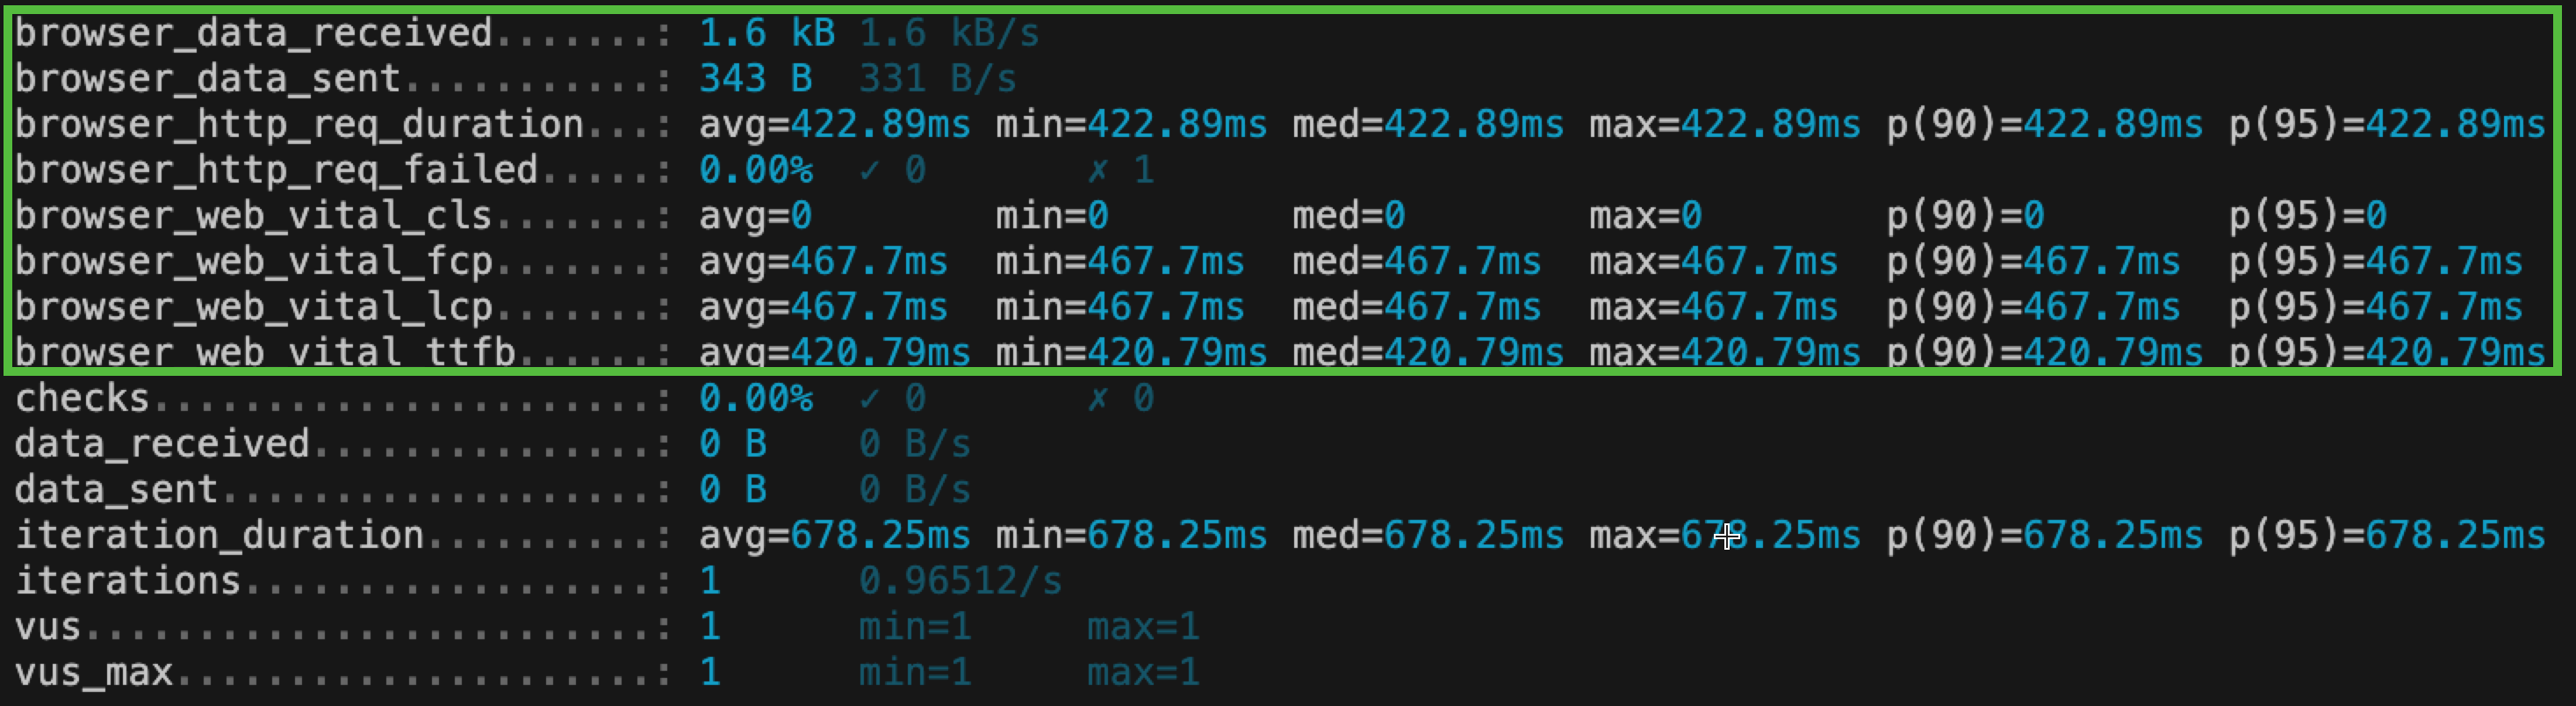
Here is the output breakdown.
-
browser_data_received: This section shows statistics related to data received by the browser during the test.
-
1.6 kB: The total amount of data received by the browser during the test. -
1.6 kB/s: The data receiving rate, indicating the rate of data transfer per second.
-
-
browser_data_sent: This section shows statistics related to data sent by the browser during the test.
-
343 B: The total amount of data sent by the browser during the test. -
331 B/s: The data sending rate, indicating the rate of data transfer per second.
-
-
browser_http_req_duration: These statistics provide information about the duration of HTTP requests made by the browser.
-
avg=422.89ms: The average duration of HTTP requests in milliseconds. -
min=422.89ms: The shortest (minimum) request duration. -
med=422.89ms: The median (middle) request duration. -
max=422.89ms: The longest (maximum) request duration. -
p(90)=422.89ms: The 90th percentile of request durations. -
p(95)=422.89ms: The 95th percentile of request durations.
-
-
browser_http_req_failed: This section provides information about failed HTTP requests made by the browser.
-
0.00%: The percentage of HTTP requests that failed. -
? 0: The number of successful requests (0). -
? 1: The number of failed requests (1).
-
-
browser_web_vital_cls, browser_web_vital_fcp, browser_web_vital_lcp, browser_web_vital_ttfb: These sections report various web vital metrics that are important for measuring web page performance.
- These sections include metrics such as average, minimum, median, maximum, and percentiles for Core Web Vitals like Cumulative Layout Shift (CLS), First Contentful Paint (FCP), Largest Contentful Paint (LCP), and Time to First Byte (TTFB).
-
checks: This section reports on the success or failure of checks performed during the test.
-
0.00%: The percentage of checks that failed. -
? 0: The number of successful checks (0). -
? 0: The number of failed checks (0).
-
- data_received, data_sent: These sections show statistics related to data received and sent during the test. In this case, no data was sent or received.
-
iteration_duration: These statistics provide information about the duration of iterations (test cycles).
-
avg=678.25ms: The average duration of iterations in milliseconds. -
min=678.25ms: The shortest (minimum) iteration duration. -
med=678.25ms: The median (middle) iteration duration. -
max=678.25ms: The longest (maximum) iteration duration. -
p(90)=678.25ms: The 90th percentile of iteration durations. -
p(95)=678.25ms: The 95th percentile of iteration durations.
-
-
iterations: This section provides information about the number of iterations (test cycles) completed during the test.
-
1: The total number of iterations. -
0.96512/s: The rate at which iterations were executed per second.
-
- vus: This section shows statistics related to the virtual users (VUs) used in the test.
-
1: The current number of virtual users. -
min=1: The minimum number of virtual users. -
max=1: The maximum number of virtual users.
- vus_max: This section provides information about the maximum number of virtual users.
-
1: The maximum number of virtual users during the test. -
min=1: The minimum number of virtual users during the test. -
max=1: The maximum number of virtual users during the test.
Headless Mode
By default, k6 runs the test in headless mode. To turn off it, issue K6_BROWSER_HEADLESS=false k6 run <your-script>.js
This will launch the Chromium browser and perform the scripted actions.
You can also interact with the application using Locator object. k6 also supports Asynchronous operations.
Recommended Way to Test
It is always ideal to test both the APIs and the front-end simultaneously to get the real simulation of production. You can create both the tests in one script, or you can write two different scripts and run it simultaneously.
Conclusion
In conclusion, browser performance testing with k6 is a valuable addition to your toolkit for assessing and optimizing the performance of web applications. With its user-friendly approach, bundled browser capability, and the power of the Chromium Developer Protocol, k6 simplifies the process of evaluating client-side performance and empowers you to build faster, more efficient, and more reliable web applications. It's a powerful tool that every performance engineer and developer should consider in their testing repertoire.

Top comments (0)