 <!-- wp:paragraph -->
As a performance engineer, you know how crucial it is to expand your skillset and become proficient with various tools. In your demanding role, ensuring the optimal performance of applications and systems is paramount. To achieve this, you need a diverse range of tools and techniques in your arsenal.
In this blog article, you're about to embark on a journey to explore a valuable addition to your toolkit: Vegeta, an HTTP load testing tool and library. As a performance engineer, you're likely no stranger to the importance of load testing in evaluating and enhancing system performance. Vegeta is one such tool that will help you accomplish this more effectively.
By delving into the world of Vegeta, you'll gain insights into its features, capabilities, and practical applications for load testing. This knowledge will empower you to handle a higher volume of users and requests while ensuring your systems maintain peak performance. So, let's dive in and discover how Vegeta can further elevate your performance engineering expertise.
Vegeta - HTTP load testing tool and library
Vegeta is an open-source HTTP load testing tool and library designed to help evaluate and analyze the performance of web services, servers, and applications by simulating a large number of HTTP requests. It was created in the Go programming language and is widely used for performance testing and benchmarking.
Vegeta is particularly popular among developers and performance engineers because of its simplicity, ease of use, and the ability to conduct performance tests efficiently. It's worth noting that while Vegeta is a powerful tool for HTTP load testing, users should always ensure they have appropriate permissions and are following ethical and legal guidelines when testing web services and applications.
Vegeta Features
- CLI and Go-based tool
- Easy to learn and pluggable in automation workflow
- Customizable HTML reporting
- Simple distributed load testing using pdsh
- Easy to install, update, and manage
- Avoids Coordinated Omission

Install Vegeta
In macOS, you can install Vegeta using brew.
brew update && brew install vegetaFor Windows, make sure you have installed Go. To install vegeta, use
go get -u github.com/tsenart/vegetaTo validate vegeta:
vegeta -versionSimple Load Test
To begin a simple load test in vegeta, issue the below command.
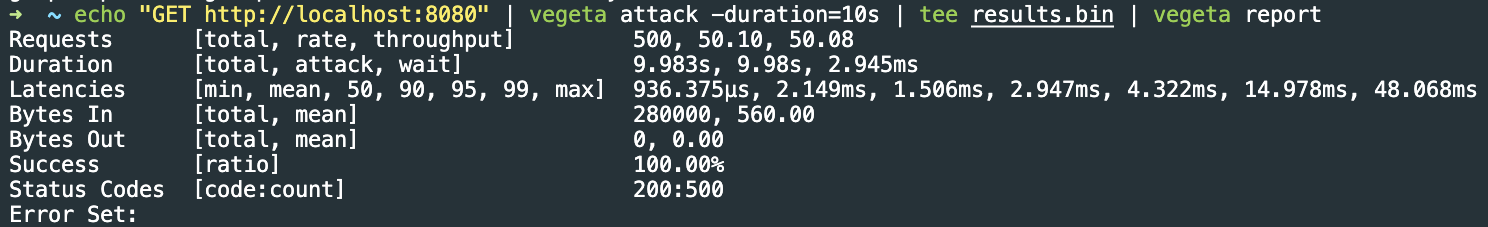
echo "GET http://localhost:8080" | vegeta attack -duration=10s | tee results.bin | vegeta reportThe above command will attack the localhost for 10s, store the results in results.bin and creates a report in the current directory.
The results will be stored in a bin format. To create a HTML report, use the below command:
cat results.bin | vegeta plot > plot.htmlTo plot histogram in the terminal, issue the below command:
cat results.bin | vegeta report -type="hist[0,100ms,200ms,300ms]"Vegeta defaults
By default vegeta uses the following properties:
- CPUs - number of CPUs you have
- Number of connections - 10000
- Rate - 50 requests per second
- DNS TTL - 0s
- Duration of the test - infinity
- HTTP2 - if the server supports
- Maximum size of response body - no limit
- Maximum number of workers - 18446744073709551615
- Output file - stdout
- Redirects - 10
- Targets - stdin
- Timeout - 30s
- Workers - 10
There are defaults for plot and report as well.
Important arguments to remember
When running a performance test, it is paramount to configure the right values so that the test will work as per workload model. The following are the important command and arguments to remember in vegeta.
attack - this command generates load and executes the HTTP instructions. It is important to configure the duration of the test in seconds and rate - number of requests per time unit i.e. throughput.
If the HTTP verb is POST, then you need to add appropriate body, headers, tls, redirects, resolvers and more.
When it comes to report, ensure you mention histogram buckets, output file, and type.
For the plot, configure the threshold, output, and title.
More examples
If you are new to vegeta, below are the handy examples which will be useful.
Attacking with headers
echo "GET http://localhost:8080
X-Track: vegeta-test" | \
vegeta attack -duration=10s | \
tee results.bin | \
vegeta report
Attacking with multiple endpoints
echo "GET http://localhost:8080
X-Track: vegeta-test"

GET http://localhost:8080/leaderboard" | \
vegeta attack -duration=10s -name emojivoto | \
tee results.bin | \
vegeta report
Attacking with POST request
echo "POST http://localhost:8080" | vegeta attack -duration=10s | tee results.bin | vegeta reportAttacking with rate
echo "GET http://localhost:8080" | vegeta attack -duration=10s -rate=100/s | tee results.bin | vegeta reportAttacking with payload
echo "POST http://localhost:8080
@data.json" | vegeta attack -duration=10s | \
tee results.bin | \
vegeta report
Attacking with comments
echo "POST http://localhost:8080
# sending with payload
@data.json" | vegeta attack -duration=10s | \
tee results.bin | \
vegeta report
Distributed load testing in Vegeta
Distributed testing is the core feature for any performance testing tool. It helps in distributing the load to scale the workload. Vegeta's approach is kind of unique while comparing with other tools like JMeter, k6, or Locust.
Vegeta leverages pdsh (Parallel Distributed Shell) is an open-source, high-performance parallel remote shell utility that allows system administrators and users to execute shell commands or scripts on multiple remote hosts simultaneously. It is particularly useful for managing and automating tasks on multiple servers or clusters in parallel.
pdsh is widely used in environments where parallel or distributed system administration and automation are essential. It simplifies the management of large clusters of servers and allows administrators to streamline tasks that would otherwise be time-consuming when performed on each host individually.
To demo the distributed load testing feature in vegeta, let us spin up multiple virtual machines using multipass.
Multipass is a lightweight, cross-platform virtual machine (VM) management tool developed by Canonical, the company behind Ubuntu Linux. It provides a simple and convenient way to create, manage, and run virtual machines on various operating systems, including Windows, macOS, and Linux. Multipass is designed to be user-friendly, making it easy for developers, sysadmins, and others to work with virtual machines for development, testing, and various computing tasks.
Multipass is commonly used for various purposes, including software development, testing, running isolated development environments, and experimenting with different Linux distributions. It simplifies the process of working with virtual machines, especially for those who prefer a command-line interface and want a straightforward way to create and manage VMs.
You can check https://multipass.run/install to get started. First, let us create two virtual machines (vm) for this demo. The below command will create two vms worker1 and worker2 with 2 CPU and 4 GB memory each with Ubuntu 23.04.
multipass launch --name worker1 23.04 -c 2 -m 4gb multipass launch --name worker2 23.04 -c 2 -m 4gbOnce it is created, you can list out all the vms using the below command.
multipass listThe next step is to login into the worker1 and issue the below commands.
sudo apt update
sudo apt install golang -y
To install vegeta, grab the right download url from https://github.com/tsenart/vegeta/releases/tag/v12.11.1 and download using the below command.
curl -L -o vegeta_12.11.1_linux_arm64.tar.gz https://github.com/tsenart/vegeta/releases/download/v12.11.1/vegeta_12.11.1_linux_arm64.tar.gz

tar -xf vegeta_12.11.1_linux_arm64.tar.gz

sudo mv vegeta /usr/local/bin/
Now repeat the above steps for worker2. Once the vegeta is installed, return to your local to install pdsh using the below command.
brew install pdshThe next step is to grab the IP address of worker1 and worker2 using the below command.
multipass listTo SSH into the VMs, you need to copy your public key into them using ssh-copy.
ssh-copy-id -i ~/.ssh/id_rsa.pub ubuntu@192.168.205.13
ssh-copy-id -i ~/.ssh/id_rsa.pub ubuntu@192.168.205.14
Now set this environment variable in your local.
PDSH_RCMD_TYPE=ssh Trigger the attack
pdsh -l ubuntu -b -w '192.168.205.13,192.168.205.14' 'echo "GET http://example.com" | vegeta attack -rate=2 -duration=5s > result.bin'-
pdsh: This is the command used to run a command on multiple remote servers in parallel. -
-l ubuntu: This option specifies the username to use when connecting to the remote servers. In this case, it's set to "ubuntu." -
-b: This option tellspdshto execute the specified command in the background, meaning it will not wait for the command to finish on each remote server before moving on to the next one. -
-w '192.168.205.13,192.168.205.14': This option specifies the list of remote servers to target. In this case, it's set to two IP addresses: 192.168.205.13 and 192.168.205.14. -
'echo "GET http://example.com" | vegeta attack -rate=2 -duration=5s > result.bin': This is the actual command that will be executed on each of the specified remote servers. Let's break it down further:-
echo "GET http://example.com": This part of the command sends an HTTP GET request to "http://example.com." It's used to generate HTTP traffic for the load test. -
|: This pipe symbol is used to send the output of the preceding command as input to the following command. -
vegeta attack -rate=2 -duration=5s > result.bin: This part of the command utilizes thevegetaload testing tool to perform a load test. Here's what each part does:-
vegeta attack: This is the command to start a load test attack withvegeta. -
-rate=2: It specifies the request rate of 2 requests per second. -
-duration=5s: The load test will run for 5 seconds. -
> result.bin: The output of the load test will be saved to a file called "result.bin." The>symbol is used to redirect the output to the specified file.
-
-
Once the attack is done, it is important to collect the results from each machine using the below command.
for machine in 192.168.205.13 192.168.205.14; do
    scp ubuntu@$machine:~/result.bin $machine.bin &
done
After the results have been collected, below command helps you to plot the combined HTML report.
vegeta plot 192.168.205.13.bin 192.168.205.14.bin > combined_report.html# for CLI output
vegeta report *.binIntegrations
- For real time results plotting, vegeta gels with
jplotandjaggr - Integrates with Prometheus and Grafana
Conclusion
In conclusion, as a performance engineer, it's crucial for you to expand your toolkit with the right tools to succeed in your demanding role. You know that ensuring optimal performance for your applications and systems is an ongoing challenge, but with the right set of tools and techniques, you can tackle this challenge effectively.
Throughout this article, we've taken you on a journey to explore a valuable addition to your toolkit: Vegeta, an HTTP load testing tool and library. You understand that load testing is a fundamental part of evaluating and enhancing system performance, and Vegeta offers a robust solution to help you achieve your goals.
By delving into the world of Vegeta, we've provided you with insights into its features, capabilities, and practical applications for load testing. Equipped with this knowledge, you'll be better prepared to handle a higher volume of users and requests, all while ensuring your systems maintain peak performance.
We've covered the basics of installing Vegeta on different platforms and shown you how to perform simple load tests. We've also delved into more advanced topics like distributed load testing using pdsh. You're now aware of the importance of correctly configuring the attack, report, and plot settings to meet your specific testing needs.
Furthermore, we've demonstrated how Vegeta integrates with other tools like jplot and jaggr for real-time results plotting, as well as its seamless integration with Prometheus and Grafana for more comprehensive performance monitoring.
In your role as a performance engineer, you know that having the right tools can make all the difference. By adding Vegeta to your arsenal, you'll be better equipped to tackle the challenges of performance testing and ensure that the systems you manage continue to perform at their best. So why wait? Dive into the world of Vegeta and elevate your performance engineering expertise today. Your applications and systems will thank you for it.

Top comments (1)
Nice write-up.
Regarding the load tests tool, I suggest considering NBomber, a .NET tool for load testing. It's a modern and flexible .NET load-testing framework for Pull and Push scenarios, designed to test any system regardless of a protocol (HTTP/WebSockets/AMQP, etc) or a semantic model (Pull/Push).