
My pet project, which I named Visualizer and that I use to learn more about Redis, can start ingesting tweets from Twitter’s volume stream or from their filtered stream.
While it is doing so, Visualizer can produce a live stream of all the hashtags that are currently encountered in the ingested tweets and it ranks them too.
In this post I want to go over those parts of the system that handle new tweets, extract and publish the ranked hashtags and finally push them to the frontend to create that nice word cloud.
If you just want to see the code, here’s the GitHub link for the backend and here’s the link to the frontend. Btw. this is my third post on using Redis, so make sure to read the others too.
Visualizer Partial Architecture
Visualizer is made up of three components.
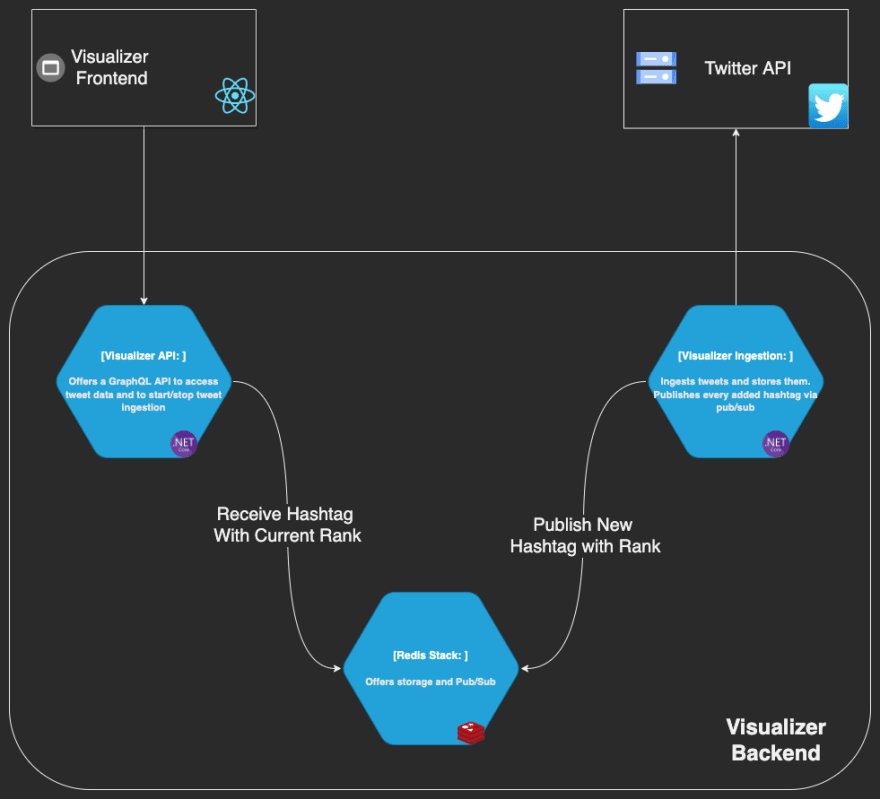
Visualizer Ingestion — An ASP.NET Core 6 service that handles the stream of tweets and stores them in Redis as indexed documents (in JSON format). It also publishes each encountered hashtag together with its rank, i.e. a count of how many times it was ever encountered by Visualizer.
Visualizer API — Another ASP.NET Core 6 service that offers access to the stored tweet data and to the live stream of ranked hashtags. GraphQL is another technology that I love and its subscriptions are ideal to push the stream of ranked hashtags to any consumer.
Visualizer Frontend — A React Typescript + ViteJs SPA to show of Visualizer’s features.
In a future post I’ll talk more about my reasons for this architecture, so follow me no to miss it.
Publishing Ranked Hashtags
As I mentioned, Visualizer Ingestion gets tweets from Twitter’s API v2 and besides persisting them it also publishes any encountered hashtag together with its rank.
The tweet data retrieval isn’t very interesting. Suffice it to say that I’m using Tweetinvi for this.
For every extracted hashtag a few things happen:
- Store and Rank: I’m storing every hashtag in a Redis Sorted Set. This Redis data structure has the expected time and space characteristics of a set, with the addition that adding an element multiple times will increase its rank each time. This is excellent for my use case as I don’t have to do much besides pumping all the hashtags in my sorted set.
Here’s the code to get an instance of IDatabase. It is probably best to add it to your DI container.
Afterwards I’m adding the hashtag to a sorted set and I’m telling Redis to increment the rank of this hashtag by 1. Notice that I get the new rank as a response.
- Publish Hashtag with Rank: After I got the new rank of the hashtag I’m publishing it. Here I’m making use of Redis’ Pub/Sub which allows me to publish string messages to a channel. This effectively decouples Visualizer Ingestion **from **Visualizer API.
First, you’ll need an ISubscriber instance. Like most reusable objects, I’m adding it to my DI container.
With that subscriber I can then publish my ranked hashtag to a channel
Notice that I’m using a RankedHashtag DTO to represent the hashtag and its rank and that I’m serialising it to a JSON string before publishing. Also notice that I’m using a constant for the channel name. That’s because the constants live in a shared project in the same solution and are reused by Visualizer API.
Consuming Ranked Hashtags
The stream of ranked hashtags is consumed by Visualizer API. It does so by subscribing to the same channel that Visualizer Ingestion uses to publish each hashtag with its current rank.
In a singleton service, I’m registering a handler for new hashtags in that stream
In the handler, each channel message is deserialised to an instance of RankedHashtag *and passed on to any GraphQL subscriber
The *_rankedHashtagStream that you see there is a plain Reactive Extensions ReplaySubject with a buffer of 1
It immediately broadcasts any notification to its subscribers. But who are its subscribers, I hear you asking? Its the GraphQL API users that subscribed to the ranked hashtags; they are the subscribers.
The way that’s done in Visualizer is quite specific to my needs and to the library that I’m using, called GraphQl-Dotnet.
Please notice that the GraphQL rankedHashtag subscription takes an argument called sampleIntervalSec with a default value of 0. That value is used to determine if a subscriber should receive all the ranked hashtags as soon as they come (commonly referred to as real-time, but not in its strict sense), or if the subscriber should receive another stream of ranked hashtags which is obtained by sampling the “real-time” stream every sampleIntervalSec seconds.
Visualizer Frontend
This might be the least interesting part of the system because it only deals with data retrieval and rendering. It uses Apollo Client for React to connect to **Visualizer API **and react-wordcloud to render the data.
At a high level, the frontend retrieves the top 50 hashtags, sorted descendingly by their rank (not shown in this post, but it is a simple sorted set operation). This is in order to have something to display in the wordcloud.
Then it subscribes to the stream of ranked hashtags and whenever a ranked hashtag arrives, it either overwrites one of the existing 50 hashtags or it is added to the same set.
Subscribe to Ranked hashtags
I’m using the codegen feature of Apollo Client to create a nice React hook for subscribing to the ranked hashtags
Then my component is re-rendered every time a new ranked hashtag is available. I’m merging the new ranked hashtag with the initial 50
Ranked Hashtags Wordcloud
Conclusion
Displaying a nice little word cloud involves a few system components and multiple concepts, but each is easy to understand.
Let me know if you like these posts, with more code than usual. Give the post a ❤️ to let me know and follow me not to miss any future posts on Redis.

Top comments (0)