
I recently worked on an open source project called Jupiter, an online AI written in JavaScript to beat the popular online game 2048.

The AI uses the Monte Carlo Tree Search (MCTS) algorithm, which makes moves based on the results of many simulations of random games, also known as Monte-Carlo simulations.
I've written an article on how this algorithm works, how it can be implemented, and where MCTS can be useful. I highly recommend reading that article:

Here's a brief summary of the algorithm that you can feel free to skip if you've read the above article or you understand it already:
To find the optimal move at any given position, the program conducts a set of simulations for each possible move in that position (ex: left, right, up, or down). For each set of simulations, the algorithm starts by playing the move for that set first.
After that, the rest of the game can be played completely randomly until it is over. The algorithm can then gather the total final game scores (sum of all the tiles on the board) of all the simulations, and average them for each set. We can then find the optimal move by optimizing for the highest final game score.
For example, there could be 50 simulations where the first move was left, in which the average score for those simulations was 250. Support there were 50 simulations for each of the right, up, and down moves, and the average score for the 50 simulations in each of those was only 225. In this case, the optimal move would be left since the algorithm optimizes for the move that yields the highest final game score.
In this article, I'll be analyzing the performance and speed of Jupiter's algorithm with empirical data, and note potential improvements made to the algorithm and its JavaScript implementation on the web.
Let's start with a few definitions that are relevant to the rest of the article:
- Performance: how well the AI performs at the end of each game, in which a higher final game score would be better
- Speed: how fast the AI performs in real-world speed running on the web in JavaScript, in which a higher speed to perform moves would be better
- Game State: a set of tiles on the board which represents the board at a specific time
- Game Score: the sum of all the tiles on the board
- Real Game: the game that is being played and shown on the browser, not a simulation
- Landmark Score/Tile: a high tile or score of a power of two like 512, 1024, 2048, or 4096
Analyzing the Performance of the Algorithm
I ran 50 trial games with the AI at 200 simulations per move in about 34 minutes (avg. 40.8s/trial), storing data after every move, including:
- Current Game Score
- Best Tile in the Board
- Average Score of Simulations
- Average Move Count of Simulations
- Milliseconds Taken to Calculate Optimal Move
- The Move Made
The default 200 simulations per move used is meant to be a baseline so that the AI runs a decent speed at all tiers of devices including phones and tablets as well as desktops and laptops. I have personally done runs with 1500 simulations per move and have achieved much better results there while sacrificing speed in the process.
Game Score and Best Tiles
In all of the 50 simulations done, 96% reached at least the 1024 tile, 62% reached at least the 2048 tile and 2% reached the 4096 tile. None of the simulations reached a tile beyond 4096.
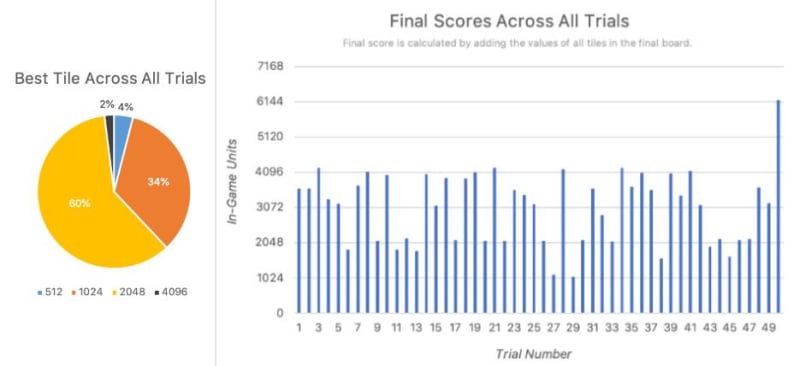
For game score, all trials reached at least 1024, including the two trials which didn't get the 1024 tile itself.
In fact, there's a clear trend in which games reach a landmark game score like 2048 or 4096, but don't survive long enough to get the tile itself.
I hypothesize this is because the game begins to get very cluttered with tiles right before a landmark tile is reached. For example, one move before getting 4096, the game board must already include at least 11 tiles: 2048, 1024, 512, 256, 128, 64, 32, 16, 8, 4, and 2. In this case, the placement of the tiles could not be ideal, or a 4 tile may appear where a 2 tile was needed. As a result, the board could have all the tiles it needs to achieve a landmark tile, but is too cluttered and the game ends up ending before the landmark tile is reached.
Another trend here is in trials which ended between the 2048 and 4096 game scores. There are several of these and this is likely because of board clutter. The algorithm doesn't have a built-in heuristic for tile placement, so tiles aren't perfectly lined up in increasing order like other strategies use.
This becomes a problem for very high tiles, depending on the total simulations per move. For 200 simulations per move, it looks like 4096 is the most common to cause cluttering problems.
Jupiter is Very Different to Other AIs and Strategies
One of the most interesting things about Jupiter's algorithm is that it doesn't follow a particular strategy. Watching Jupiter play 2048, it's hard to see any sort of pattern in its moves, other than the fact that it wins most of the time.
The most common winning strategy among humans is a system where all tiles are lined up in increasing order along rows, alternating the direction in each row so that tiles can easily be added as new ones appear. Jupiter does not follow this type of strategy; in fact, it has no built-in strategy or heuristics at all.
I personally see this as an advantage which makes Jupiter a more creative AI. Jupiter's algorithm typically leads to more interesting and less predictable 2048 gameplay than other 2048 AIs or strategies. However, Jupiter's algorithm has a lack of precision that can lead to the issues with board clutter, because tiles are not algorithmically placed in a logical pattern.

The common human strategy mentioned also depends on the idea that tiles are concentrated on a particular corner, which results in two of the possible moves (up and right in the above visualization) being used much less than their counterparts. Jupiter is not like this, and makes all moves an equal fraction of the time.

What a Single Trial Game Looks Like
Let's take a look at a single game trial, trial #50, which got to the 4096 tile.
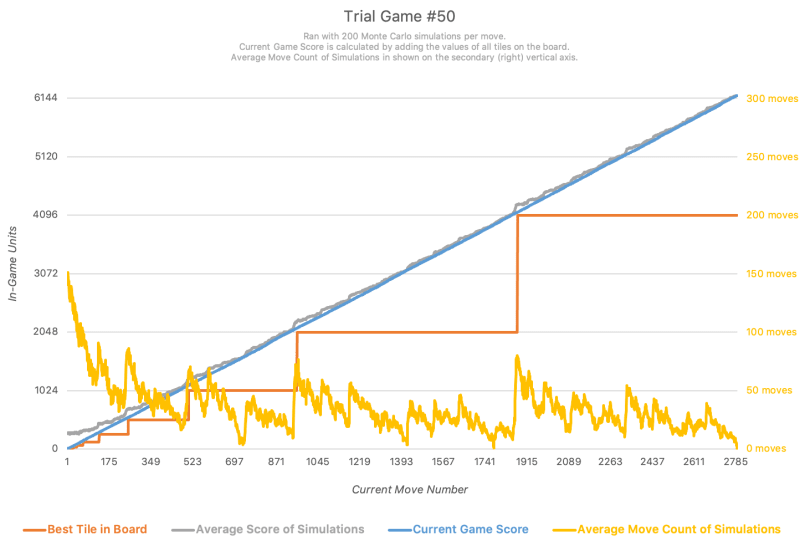
As we can see, the current game score is almost linear, with an approximate 2.2 slope. This is because in 2048, a new tile is added after each move. This new tile is typically a 2 tile, but has a 10% chance of being a 4 tile instead. Thus, the expected value of the new tile is 2.2 (2 × 90% + 4 × 10%), which increases the game score by an average of 2.2 after every move.
The average game score of all the simulations is always slightly above the current game score, because random moves incur a few tile combinations and increase the score before the simulated game ends.
And as noted previously, game score is directly connected to current game move count, where game score can be calculated by multiplying current game move count by 2.2. Therefore, spikes in average move count of simulations occur identically in the average score of simulations as well.
Notice how all three of these things occur at the same time:
- Increase in best tile
- Spike in average move count of simulations
- Spike in average score of simulations
In the graph, average score of simulations is scaled to be much smaller than average move count of simulations, so you may have to look closely to see spikes there.
As we can also see, the game score reaches a landmark before the corresponding landmark tile is actually reached — when the orange best tile line jumps up, the blue game score line has already surpassed the value of the orange best tile line.
Finally, possibly the most interesting insights we can gain from this graph are from the yellow average move count of simulations variable.
In the beginning, the average move count starts very high because there are very little tiles on the board, and the ones that are there are tiles 2 or 4. This means that simulations can survive pretty long by just playing randomly.
As higher tiles are created, the average move count starts getting lower and lower because there is more clutter and therefore a higher chance of the game ending in a shorter period of time.
The less clutter there is on the board, the higher the average move count is. Clutter is reduced by combining larger and larger tiles.
As a result of this relationship with tile combination, the amount of board clutter, and thus the average move count, we can see a clear fractal-like repeating shape, in which the average move count spikes up, goes down over time, spikes up again, goes down over time, and repeats.
These spikes are always when large tiles are created by combining smaller ones. This is corroborated by the fact that several of these spikes occur at the same time as new best tile being created (see 512, 1024, 2048 for example).
In the middle of each new best tile being created, there is another smaller spike, which we can assume is the tile half of the next best tile. For example, we can see right in the middle of 1024 and 2048 being reached, there is a large spike. This is likely when a new 512 tile was created. Subsequently we can see even smaller spikes between all adjacent spikes, corresponding to tiles being created with even smaller powers of two.
Speed Improvements for Running on the Web, in JavaScript
Speed was a key issue I faced while developing Jupiter, particularly because it runs on the web with frontend JavaScript code. Because it runs on the web, I had to make sure it could run well on lower-end devices including phones.
I made several speed improvements, starting by refactoring code in my 2048 game implementation. I made changes to the gameover checking method and move methods to make them more efficient, resulting in a ~25% increase in speed. One immediate problem I faced was that code was running on the main thread. The main thread is not only responsible for running JavaScript code, but also dealing with various events such as mouse clicks. When other JavaScript code is currently running on the main thread, it can sometimes block events from being picked up and run. To remove this blocking, I had defer code to different threads.
On the web, this is done by using Web Workers. Each Web Worker runs on a separate thread, and I found that the optimal number of Web Workers is typically eight. I divided simulations and tasks among all eight of these workers equally to optimize speed. Concurrency with workers in JavaScript is thankfully very simple and works with message passing, so this took little effort to implement.
I kept the original implementation without workers in the code to run for browsers like Opera Mini that don't support the Web Workers specification.
This increased performance greatly. On a mid-tier laptop running on battery power, I was able to run 50 trials of full games on 200 simulations per move in approximately 34 minutes. This meant that I was able to run one full game of 2048 with approximately 1600 moves in about 40.8 seconds on average. This means the AI played ~39 moves per second, with each move taking ~25 ms to calculate.
Overall, the speed improvements made in both optimizing existing JavaScript code and using Web Workers greatly improved the speed of the program, and allowed it to calculate millions of simulations for hundreds of thousands of moves in just minutes.
Conclusion
I hope you enjoyed this post, and found it interesting in analyzing performance and improving the speed of Jupiter, my 2048 AI.
Go check out Jupiter and its source code on GitHub.
Thanks for scrolling.
— Gabriel Romualdo, October 11, 2020

Top comments (0)