
If your Cosmos DB migration pipeline is taking a long time :
first thing to check is the overview page of your Cosmos Db for throttling metric in monitoring chart.
The Overview page in the Azure portal for each Azure Cosmos database includes a brief view of the database usage including its request and hourly billing usage.
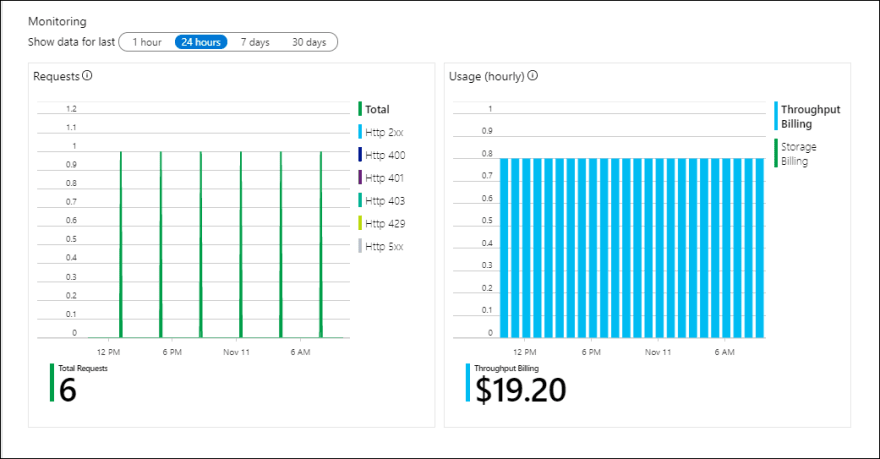
If you see multiple(more than 1-5) Http 429s in the chart , that means provisioned throughput is not enough for the amount of data you are migrating.
Pre-create containers with enough RUs
Although Azure Cosmos DB scales out storage automatically, it is not advisable to start from the smallest container size. Smaller containers have lower throughput availability, which means that the migration would take much longer to complete. Instead, it is useful to create the containers with the final data size and make sure that the migration workload is fully consuming the provisioned throughput.
If data size was estimated to be around 60 TB, a container of at least 2.4 M RUs is required to accommodate the entire dataset.
Estimate the migration speed
Assuming that the migration workload can consume the entire provisioned throughput, the provisioned throughout would provide an estimation of the migration speed. Continuing the previous example, 5 RUs are required for writing a 1-KB document to Azure Cosmos DB SQL API account.
2.4 million RUs would allow a transfer of 480,000 documents per second (or 480 MB/s). This means that the complete migration of 60 TB will take 125,000 seconds or about 34 hours.
In case you want the migration to be completed within a day, you should increase the provisioned throughput to 5 million RUs.
Secondly,
**Determine if there is a hot partition
To verify if there is a hot partition, navigate to Insights > Throughput > Normalized RU Consumption (%) By PartitionKeyRangeID. Filter to a specific database and container.
Each PartitionKeyRangeId maps to a one physical partition. If there is one PartitionKeyRangeId that has significantly higher Normalized RU consumption than others (for example, one is consistently at 100%, but others are at 30% or less), this can be a sign of a hot partition.

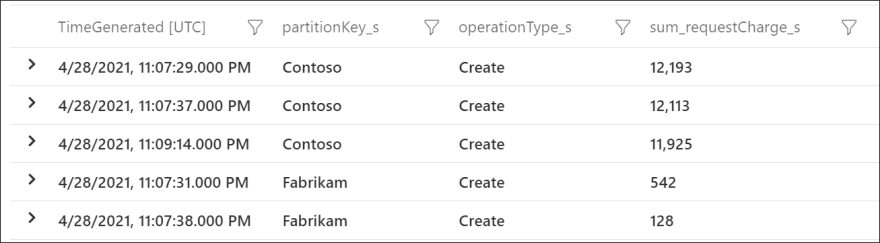
To see which logical partition keys are consuming the most RU/s, use Azure Diagnostic Logs. This sample query sums up the total request units consumed per second on each logical partition key.
Kusto
Copy

AzureDiagnostics

| where TimeGenerated >= ago(24hour)

| where Category == "PartitionKeyRUConsumption"

| where collectionName_s == "CollectionName"

| where isnotempty(partitionKey_s)

// Sum total request units consumed by logical partition key for each second

| summarize sum(todouble(requestCharge_s)) by partitionKey_s, operationType_s, bin(TimeGenerated, 1s)

| order by sum_requestCharge_s desc
This sample output shows that in a particular minute, the logical partition key with value "Contoso" consumed around 12,000 RU/s, while the logical partition key with value "Fabrikam" consumed less than 600 RU/s. If this pattern was consistent during the time period where rate limiting occurred, this would indicate a hot partition.

Top comments (0)