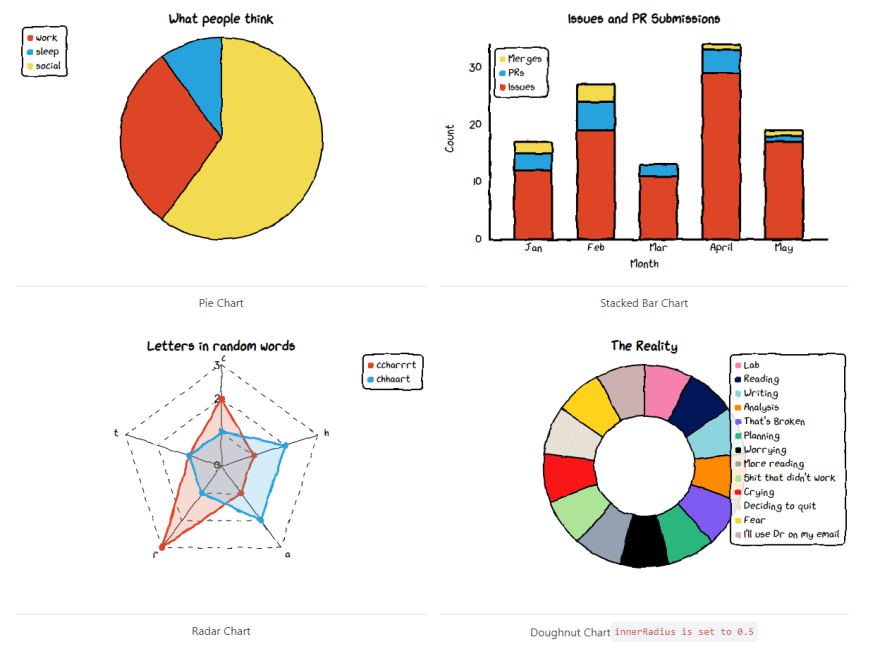
Svelte's batteries come with actions that help you integrate third-party libraries and to some extent interact with them.
Actions provide great flexibility you could directly install external libraries npm install any-package.
Svelte's API Docs states on actions
- Actions are functions that are called when an element is created.
Much of this article is a reproduction of svelte.school tutorial on actions with this tutorial I was able to make the integration.
You can see the demo https://peopledrivemecrazy.github.io/chart.xkcd-svelte/
How to use actions to integrate beautiful XKCD themed charts on svelte.
Prerequisites:
  1/ Svelte starter template (https://svelte.dev/)
  2/ XKCD Charts via NPM (https://www.npmjs.com/package/chart.xkcd)
From the library we see
- It’s easy to get started with chart.xkcd. All that’s required is the script included in your page along with a single
<svg>node to render the chart and the JS part of XKCD library is like this
const lineChart = new chartXkcd.Line(svg, {
  title: 'Monthly income of an indie developer', // optional
  xLabel: 'Month', // optional
  yLabel: '$ Dollars', // optional
  data: {
    labels: ['1', '2', '3', '4', '5', '6', '7', '8', '9', '10'],
    datasets: [{
      label: 'Plan',
      data: [30, 70, 200, 300, 500, 800, 1500, 2900, 5000, 8000],
    }, {
      label: 'Reality',
      data: [0, 1, 30, 70, 80, 100, 50, 80, 40, 150],
    }],
  },
  options: { // optional
    yTickCount: 3,
    legendPosition: chartXkcd.config.positionType.upLeft
  }
})
We now know <svg> the node where our JS will interact and the node indeed has options that are supplied about the chart properties.
From line chart's example we can make something like this and import in .svelte file.
So let's create a new .js file and call it Line.js and exports Line.
import chartXkcd from 'chart.xkcd';

export default function Line(node,chart) {
    new chartXkcd.Line(node, chart);
}
In our App.svelte we can supply the options from a variable and pass to the node like this use:Line={line}
import Line from './Line'

let line = {
  title: 'Monthly income of an indie developer', // optional
  xLabel: 'Month', // optional
  yLabel: '$ Dollars', // optional
  data: {
    labels: ['1', '2', '3', '4', '5', '6', '7', '8', '9', '10'],
    datasets: [{
      label: 'Plan',
      data: [30, 70, 200, 300, 500, 800, 1500, 2900, 5000, 8000],
    }, {
      label: 'Reality',
      data: [0, 1, 30, 70, 80, 100, 50, 80, 40, 150],
    }],
  },
  options: { // optional
    yTickCount: 3,
    legendPosition: chartXkcd.config.positionType.upLeft
  }
}

<svg use:Line={line}></svg>
Success, Now we see it work right out of the box.
You can check out the working examples from the repo here
https://github.com/peopledrivemecrazy/chart.xkcd-svelte
PS. I made svelte wrapper for xkcd.chart NPM package


Top comments (0)