
Since I’ve joined RudderStack, we’ve made dev.to a focus. We’ve sponsored the DevDiscuss and DevNews podcasts, we’re building content specifically for dev.to, we’re seeding conversations with watercooler and discuss posts, and we’ve started including dev.to posts in our launch tactics. It’s an important channel for us, and I want to collect data around how our org and our individual posts perform.
In my previous post, we pulled data from the dev.to API into a Google Sheet, scheduled hourly refreshes with Google Apps Script, and then set up an ELT pipeline with RudderStack, using our Google Sheets Source, to send data from our Google Sheet to Snowflake on an hourly schedule.
In this post, I’m going to build visualizations for our dev.to data with Looker, the primary BI tool we use at RudderStack.
Building a data composite in Snowflake
We had to pull 2 different data types from dev.to’s API. The first was for all the posts under the RudderStack org, but that didn’t include data on post views. To get post views, we had to do another set of API calls that used individual author’s API keys. So we have all the data we need, but it lives in 2 different schemas in our data warehouse, DEVTO_ORG and DEVTO_ACT

I want to combine these schemas into a composite so that I don’t have to deal with joining tables for every visualization I build in Looker. The simplest way to do this is to create a view in Snowflake, which uses a SQL statement to create a virtual table that you can query.
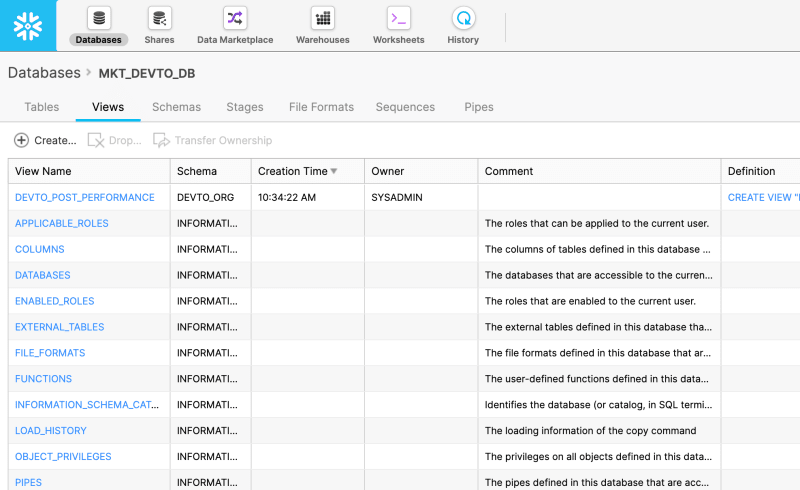
- Login to Snowflake and click on the “Databases” icon in the top navigation.
- Click on the database you created for your dev.to data, mine is called MKT_DEVTO_DB.
- Click on the “Views” tab.

- Click the “Create” button.
-
Give your new view a name, select the schema you want it to belong to, and enter the SQL query that joins your data and defines your view. The SQL query I used is below. You probably want to go to Worksheets and experiment with your SQL query before using it to define your view.

select
  orgTable.TYPE_OF, orgTable.URL, orgTable.TITLE, orgTable.TAG_LIST,
  orgTable.USER_USERNAME, orgTable.ORGANIZATION_USERNAME, actTable.PAGE_VIEWS_COUNT,
  orgTable.POSITIVE_REACTIONS_COUNT, orgTable.PUBLIC_REACTIONS_COUNT,
  orgTable.COMMENTS_COUNT, orgTable.LAST_COMMENT_AT, orgTable.CREATED_AT,
  orgTable.EDITED_AT, orgTable.PUBLISHED_AT, orgTable.SENT_AT,
  TIMESTAMP_FROM_PARTS(YEAR(orgTable.SENT_AT),MONTH(orgTable.SENT_AT),
  DAY(orgTable.SENT_AT),HOUR(orgTable.SENT_AT),0,0) as simpleSentAt
from MKT_DEVTO_DB.DEVTO_ORG._ROWS as orgTable
left outer join MKT_DEVTO_DB.DEVTO_ACT._ROWS actTable on
  orgTable.url = actTable.url and
  (YEAR(orgTable.SENT_AT) = YEAR(actTable.SENT_AT) and
  MONTH(orgTable.SENT_AT) = MONTH(actTable.SENT_AT) and
  DAY(orgTable.SENT_AT) = DAY(actTable.SENT_AT) and
  HOUR(orgTable.SENT_AT) = HOUR(actTable.SENT_AT))
order by
  simpleSentAt desc, orgTable.PUBLISHED_AT desc
Click the “Finish” button.
Now we have a view that we can query just like a table. You can go to Worksheets and experiment with querying your view to make sure that it is working as desired.
Building your visualizations in Looker
Setting up your data connection and LookML project
- Login to Looker.
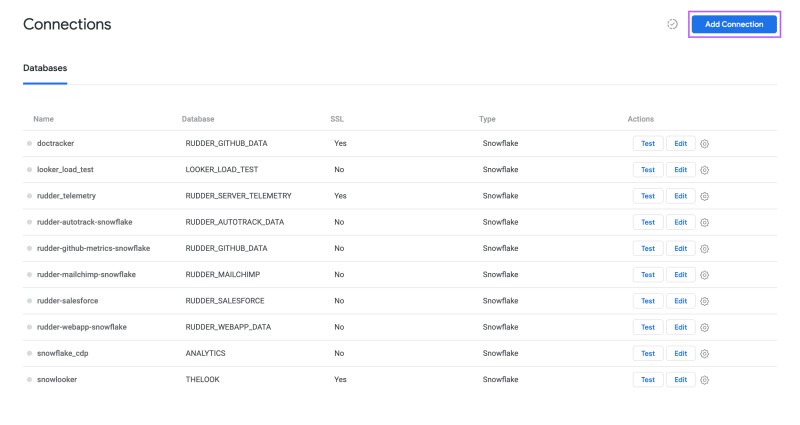
- Click on Admin > Database > Connections.
- Click the “Add Connection” button.
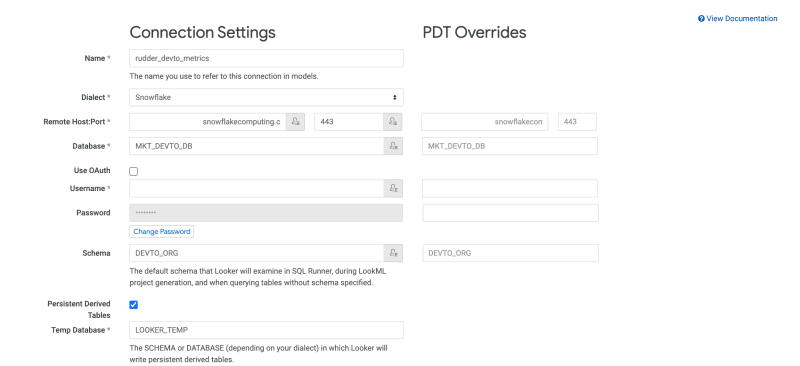
- Enter a Name, Dialect, Remote Host and Port, Database, schema, and your data warehouse authentication credentials for your dev.to data, check the “Persistent Derived Tables” checkbox, set your “Temp Database”, and click the “Add Connection” button.
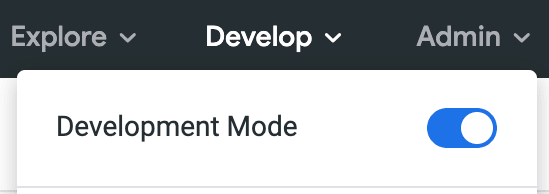
- Click on Develop > Development Mode (turn on)
- Click on Develop > Manage LookML Projects
- Click the “New LookML Project” button.

- Enter a Project Name, select Generate Model from Database Schema, select your dev.to connection, enter “DEVTO_ORG” as your Schema, and click the “Create Project” button.

- On the new project page, click the “Configure Git” button.

- Create a git repo (here’s ours) and connect your LookML project to the repo (I recommend using the
git@github.com:myorganization/myproject.gitstyle connection and a deploy key for this). - Make sure you commit and deploy your project to production.
Model, views, and dashboards
If you go to our looker-devto repo, you can find the model, views, and dashboards we have built for our dev.to reporting. You can take and implement these (probably with some minor tweaks) in your Looker.
Model
- rudder_devto_metrics - The model is nothing special. The primary thing it does is defines the views that will be visible in the Explore menu.
Views
- devto_post_performance - A view that pulls all of post performance data from the DEVTO_POST_PERFORMANCE view created in Snowflake earlier in this post.
- devto_post_performance_current - A view that pulls post performance data from the DEVTO_POST_PERFORMANCE view only from the most recent sync.
- devto_post_performance_1_week - A view that pulls post performance data from the DEVTO_POST_PERFORMANCE view only from 1 week before the most recent sync.
- devto_post_performance_1_month - A view that pulls post performance data from the DEVTO_POST_PERFORMANCE view only from 1 month before the most recent sync.
Dashboards
- devto_org_performance - This dashboard shows current vs. 1 week ago vs. 1 month ago metrics for our org’s 4 key dev.to KPIs - post count, total post views, total post reactions, total post comments - and table that show all posts and their up-to-date performance.

- devto_post_performance - This dashboard shows a table that has all posts and shows post performance over time - one graph each for post views, post reactions, and post comments - with the post selection being done on the dashboard filter.


Top comments (3)
I am absolutely trying this on stream next week.
Actually, you wanna know the best way to do it. Instead of using Google Sheets and RS Cloud Extract, create a Node.JS source in RS, then make a serverless function that is scheduled every hour that hits the dev API and send the data to RS via the Node source. Less moving parts, more reliable timing, and works w/ RS Free.
Then spin up a Metabase and use it for analytics.
Spin up an open source Metabase and do it with that.
Some comments may only be visible to logged-in visitors. Sign in to view all comments.