
There are umpteen performance testing tools available in the commercial market as well as in the open source repositories. Based on our requirements, we can choose the best tool from the arsenal. Recently, Go based performance testing tools are exploding in the open source world. Go runtime provides very light-weight goroutines which execute the tasks quickly and efficiently. In this blog post, we are going to see about Iter8 - a simple Go based performance testing tool which validates the SLOs, performs Chaos testing, and more.
Iter8
There are a couple of things you should be aware. Iter8's (pronunciation - Iter-eight) primary target audience are DevOps, MLOps, Developers, Performance Engineers and Testers in this order.
Iter8 is a command line interface tool which sends loads of requests to the target URL and then evaluates the SLOs and, optionally, you can generate an HTML report.
Iter8 gels with the CI/CD and GitOps pipelines and is apt for the Kubernetes ecosystem.
Getting Started with Iter8
Installing Iter8 is simple and easy. There are multiple methods you can follow to install Iter8: via Binaries, Brew, from the Source or using Go.
I am in the Windows ecosystem. I am going to use Go to install Iter8. The only prerequisite in this method is to have the latest version of Go installed.
Download Go from https://go.dev/dl/ and install it.
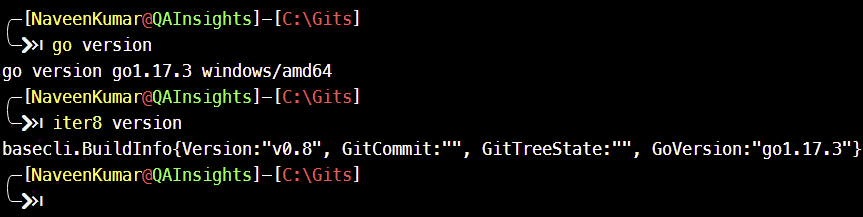
To validate the installation, open Windows Terminal or Command Prompt and enter go version.
To install Iter8, enter go install github.com/iter8-tools/iter8@latest
To validate Iter8 installation, enter iter8 version
Run an Experiment
The next step is to run a performance test against a URL. In Iter8, an experiment consists of an Experiment Chart (similar to Helm charts) and user inputs via command line.
Experiment Charts are available in the Iter8 GitHub repo e.g. load test experiment is located at https://github.com/iter8-tools/iter8/tree/master/hub/load-test-http which is called Iter Hub.
Right now, Iter8 has the following experiments: load-test-http and load-test-grpc.
Hello World Experiment
Let us begin with a simple load test using load-test-http chart.
Enter the below command in your terminal and hit enter. This command will create a directory and download the experiment from Iter8 Hub.
iter8 hub -e load-test-http
cd into load-test-http
Below is the content in load-test-http folder.
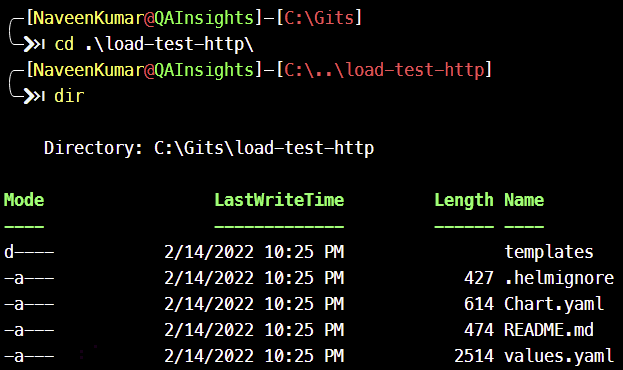
In values.yaml, the default values for the HTTP load test are available. Most of the values would be null.
In Chart.yaml, the source of the experiment and the API definition can be seen.
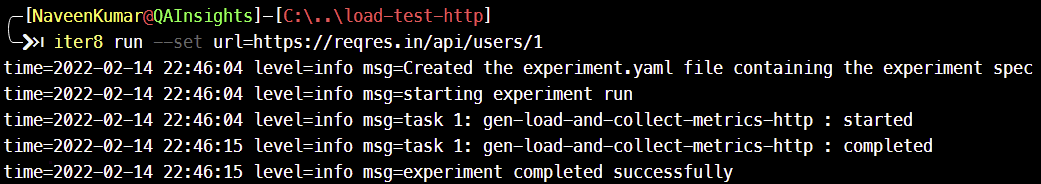
To run an experiment against https://reqres.in (please do not put more load), enter the below command and hit enter.
iter8 run --set url=https://reqres.in/api/users/1
This command will generate an experiment.yaml in the current directory. Below is the content of experiment.yaml.
# task 1: generate HTTP requests for application URL
# collect Iter8's built-in HTTP latency and error-related metrics
- task: gen-load-and-collect-metrics-http
  with:
    qps: 8
    connections: 4
    errorRanges:
    - lower: 400
    versionInfo:
    - url: https://reqres.in/api/users/1
By default, Iter8 will send 8 queries per second with 4 parallel connections for the duration will be automatically calculated.
Below is the output of the above experiment.
Once the experiment is done, Iter8 will generate result.yaml which contains the performance metrics such as latency, error count, error rate and more with the aggregation of min, max, percentiles, mean, standard deviation and more.
To generate the visualization, enter the below command which will generate a simple HTML report.html in the current directory.
iter8 report -o html > report.html
Open report.html in your favorite browser.
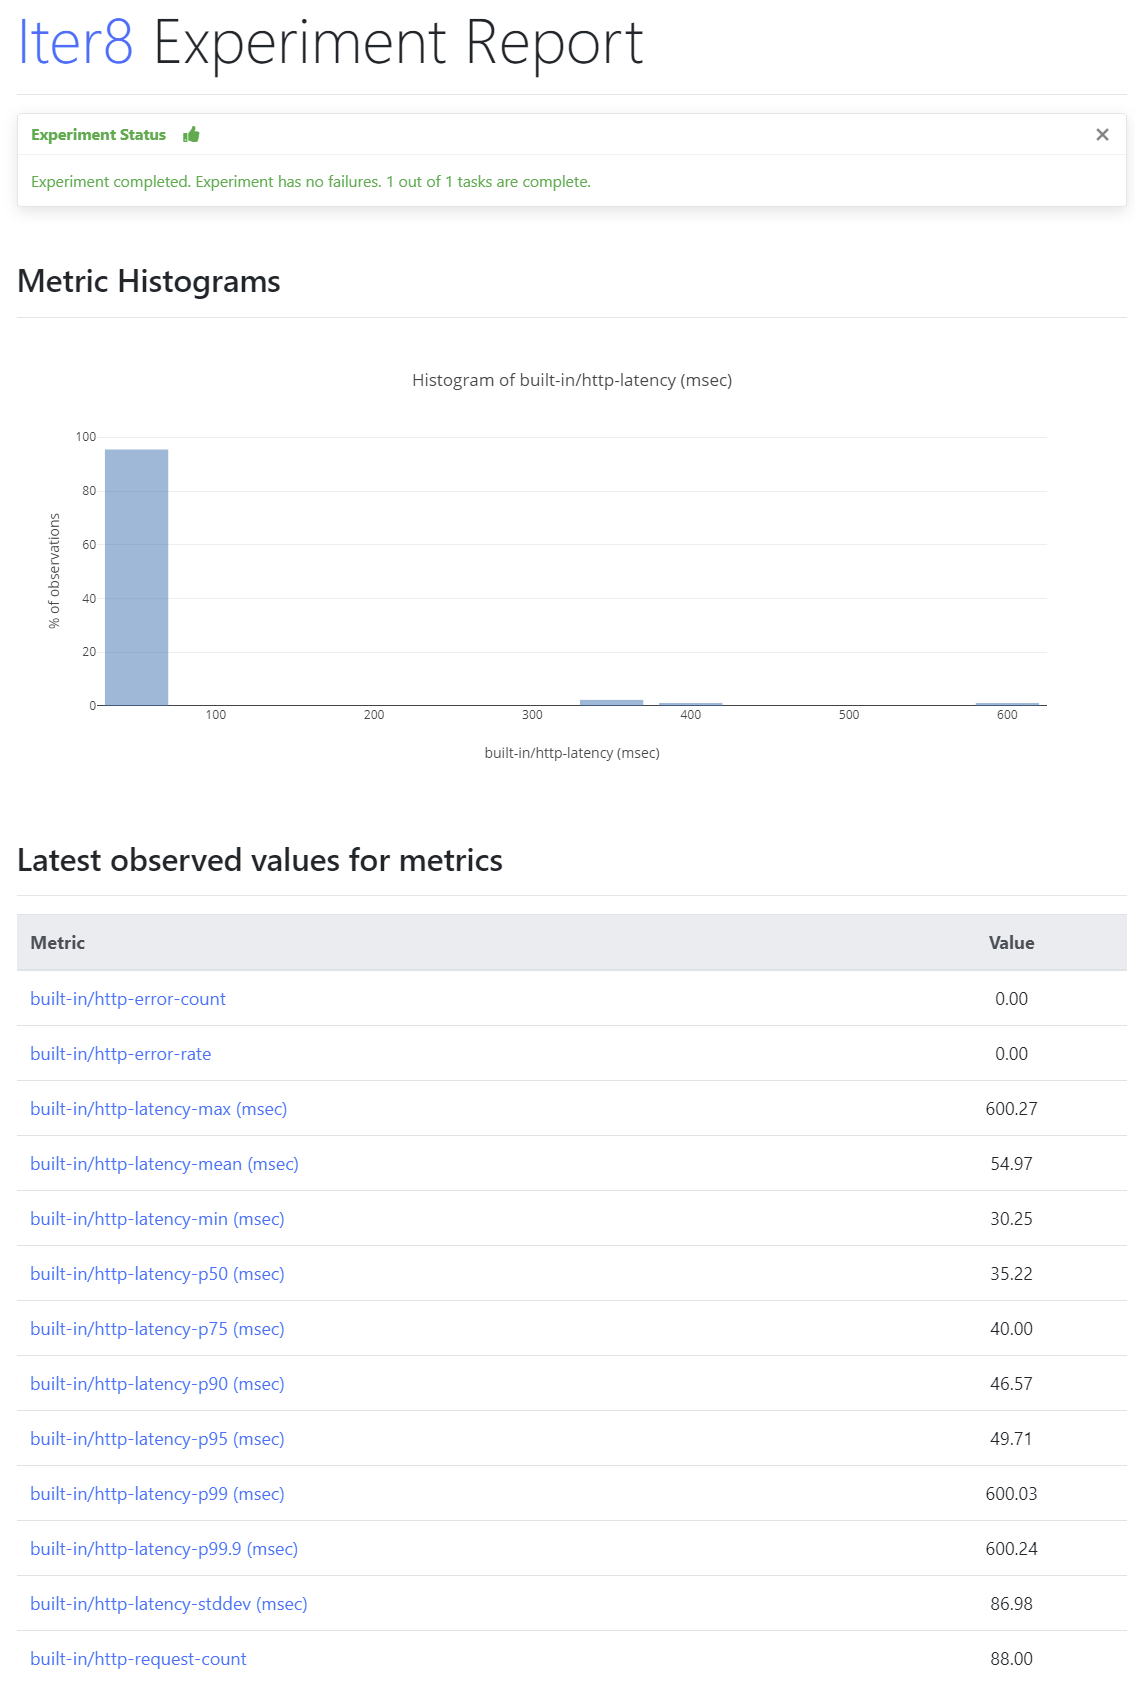
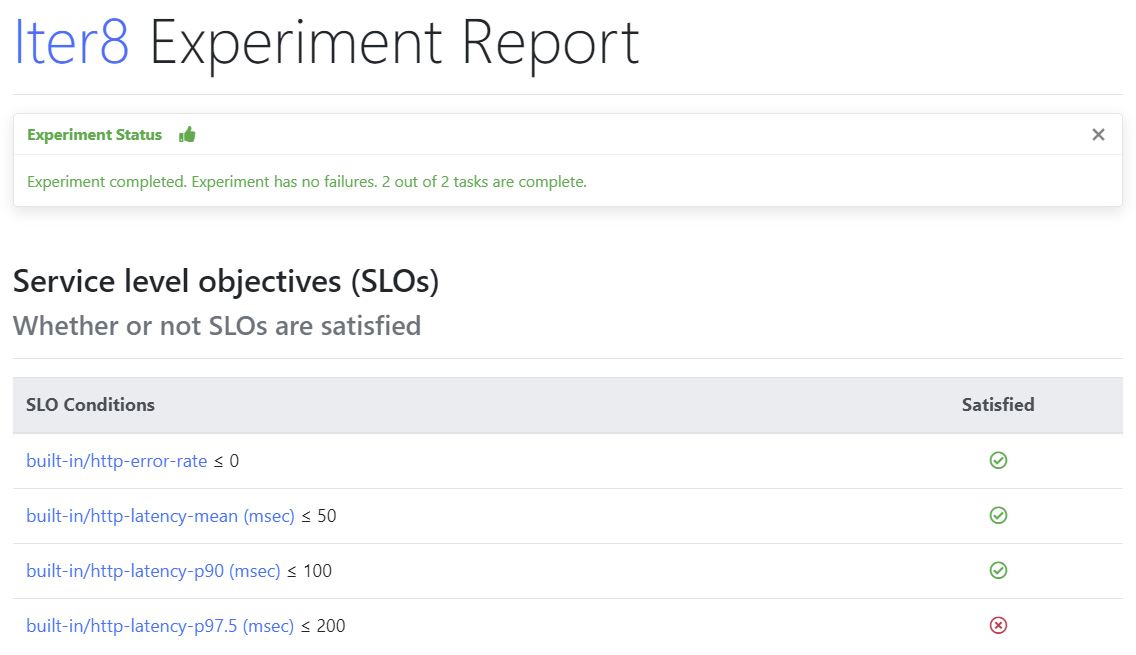
The HTML report consists of an Experiment Report, Histogram analysis, and metrics as shown above.
Following are the default metrics and SLOs collected by load-test-http experiment.
-
request-count: total number of requests sent -
error-count: number of error responses -
error-rate: fraction of error responses -
latency-mean: mean of observed latency values -
latency-stddev: standard deviation of observed latency values -
latency-min: min of observed latency values -
latency-max: max of observed latency values -
latency-pX: Xth percentile of observed latency values, forXin[50.0, 75.0, 90.0, 95.0, 99.0, 99.9]
Sending POST request
Iter8 supports the POST method as well. Below is an example of a POST request.
iter8 run --set url=https://reqres.in/api/users `
--set payloadStr="{"name":"morpheus","job":"leader"}" `
--set contentType="application/json"
Assertions
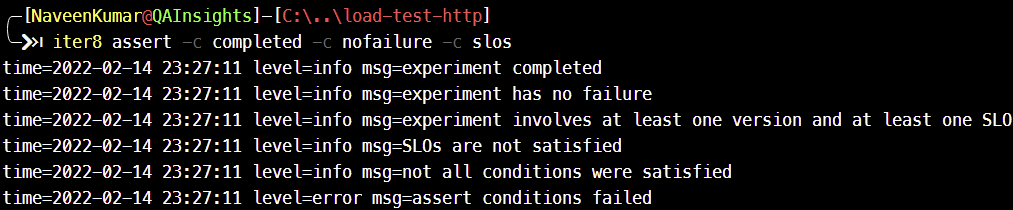
Iter8 supports assertions to validate the output of each experiment. Send the below command which checks for completion, failures, and SLOs.
iter8 assert -c completed -c nofailure -c slos
SLOs
Below command sets the various SLOs.
iter8 run --set url=https://reqres.in/api/users/1 `
--set SLOs.error-rate=0 `
--set SLOs.latency-mean=50 `
--set SLOs.latency-p90=100 `
--set SLOs.latency-p'97\.5'=200
For the above experiment, SLOs might fail, as shown below.
Iter8 Features
Load testing is one of the features of Iter8. Apart from load testing, it supports A/B testing, K8s ecosystem, serverless, ML frameworks, and more.
There are experiments available with Prometheus, Chaos testing, mirroring, traffic split, session affinity, gradual traffic shifting, and more.
I hope there will be more experiments available in the repo in the near future.
What is missing?
As a performance engineer, my expectations are high. Iter8 supports only a minimal subset of features for performance testing. E.g. distributed load testing and aggregation, data parameterization, easy debugging, UI performance, other protocols, and more are missing in this release.
Conclusion
The pitch of Iter8 is Kubernetes Release Optimizer where the users will conduct experiments either locally or in the Kubernetes ecosystem or via CI/CD/GitOps pipelines, and try out various versions, configurations, and modelling to find the best deployment for production.
Iter8 is one of the easiest frameworks to learn. Definitely you should check it out and see whether it can be used by your team.

Top comments (0)