
In last two blog articles, we have seen about the JMeter Integration with InfluxDB and Grafana using Docker and InfluxDB 2.0. This blog article focuses on JMeter Integration with InfluxDB Cloud.
InfluxDB Cloud
InfluxDB Cloud is the most powerful time series database as a service — free to start, easy to use, fast, serverless, elastic scalability.
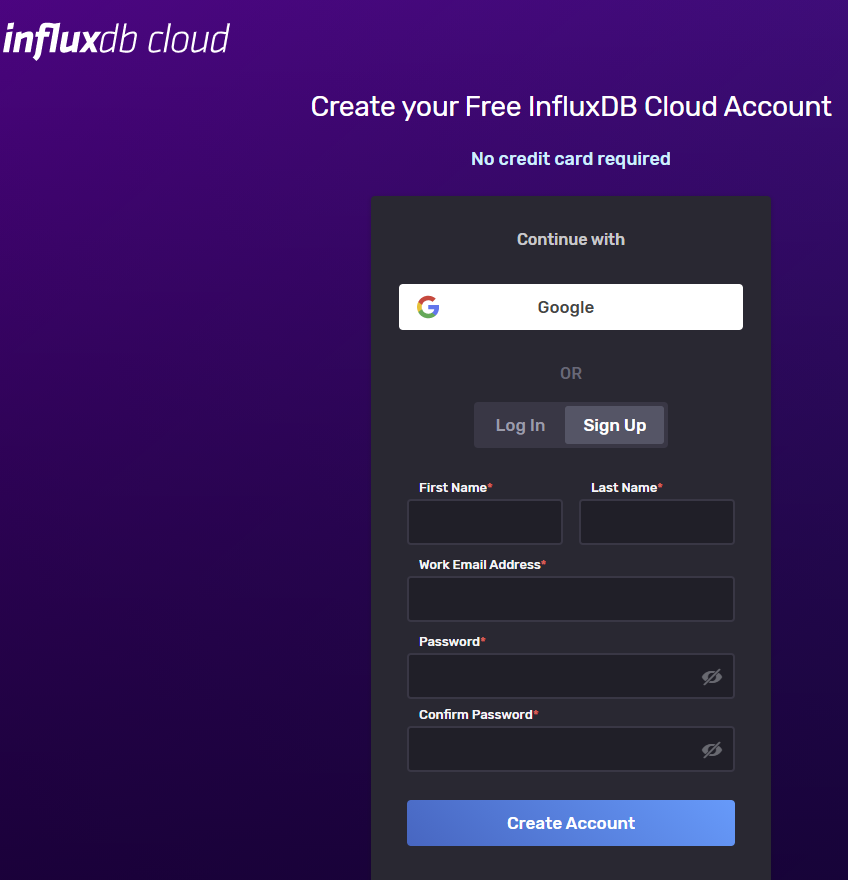
It is free to get started; no credit card required. Head to this sign up link.
Fill the required fields as shown below and hit Create Account.
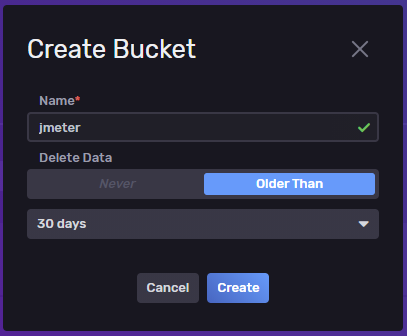
Create a bucket
Next step is to create a bucket called jmeter in InfluxDB Cloud. Navigate to Data > Buckets > Create Bucket. Enter a name for the bucket jmeter.
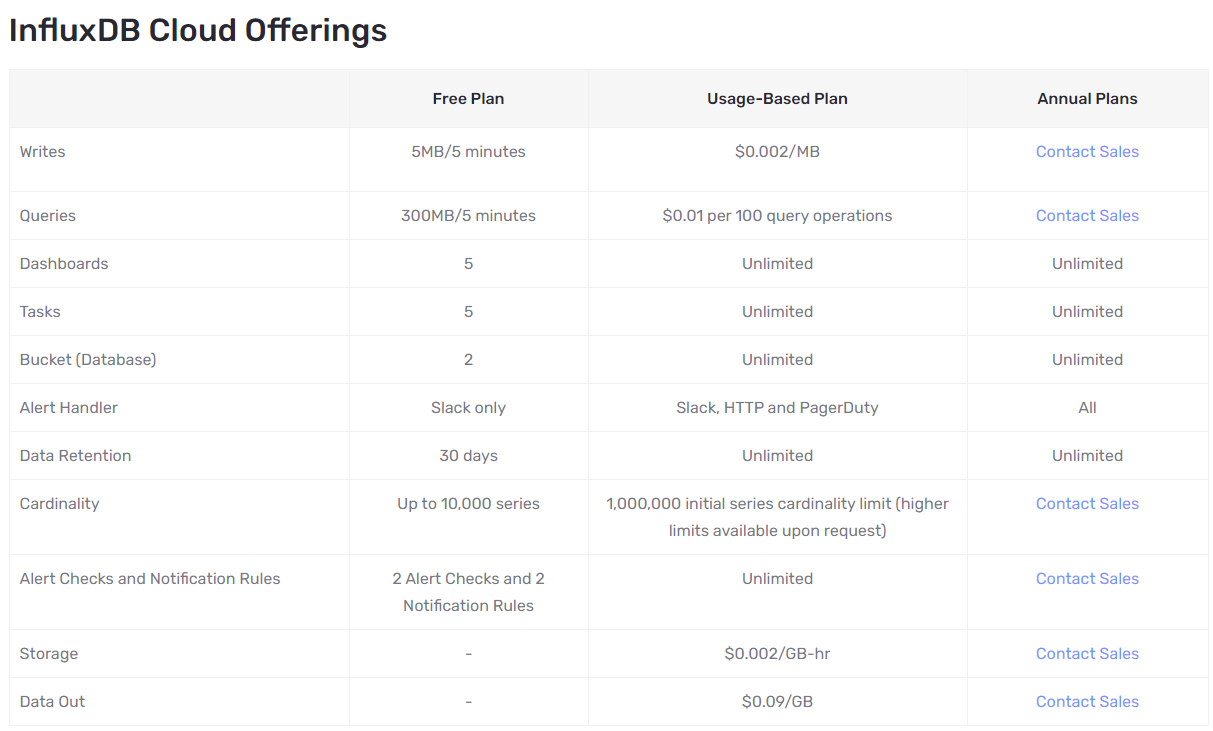
Free plan comes with rate limitations and other features as shown below.
Before leaving InfluxDB Cloud, we need few things to configure the backend listener in JMeter.
- Token
- Organization ID
- InfluxDB URL
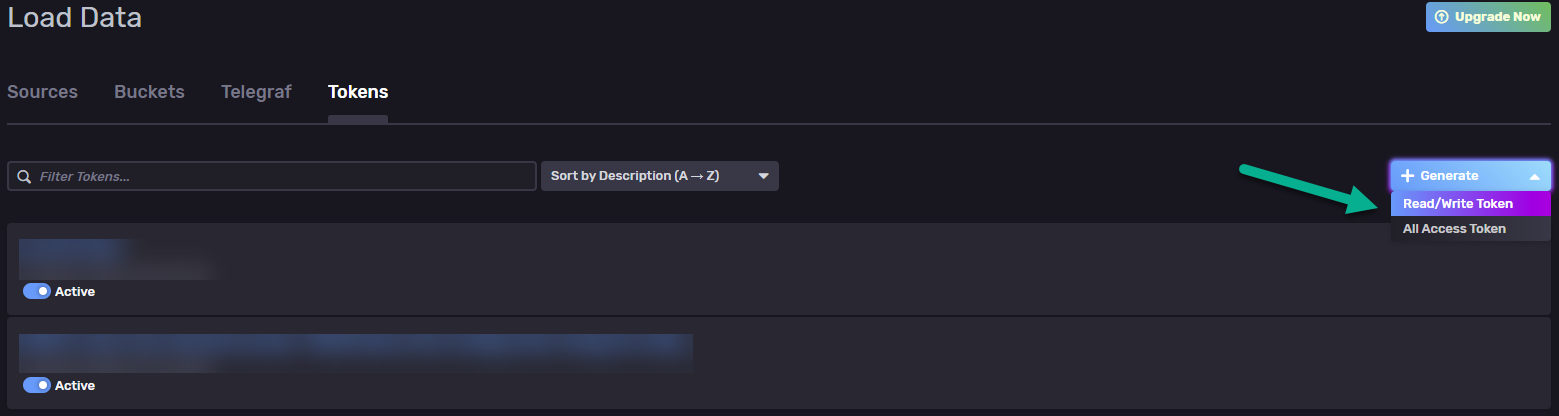
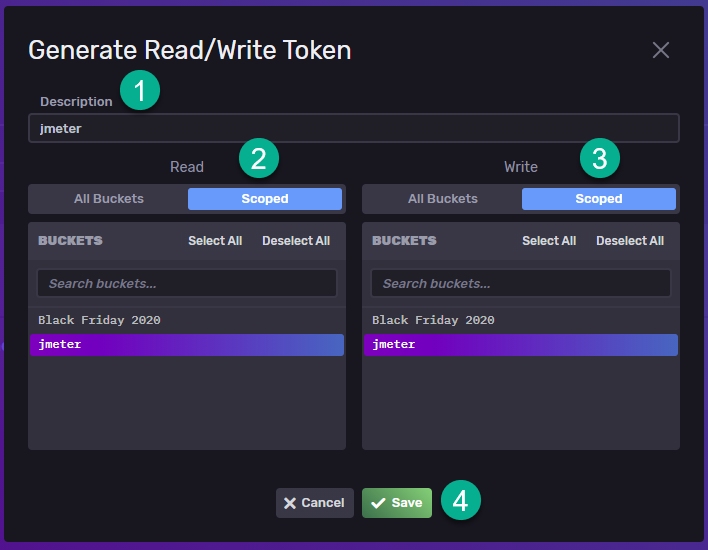
Create a Token
Navigate to Data > Token, click on Generate > Read/Write Token.
Enter the token name, select the scope and then click on Save.
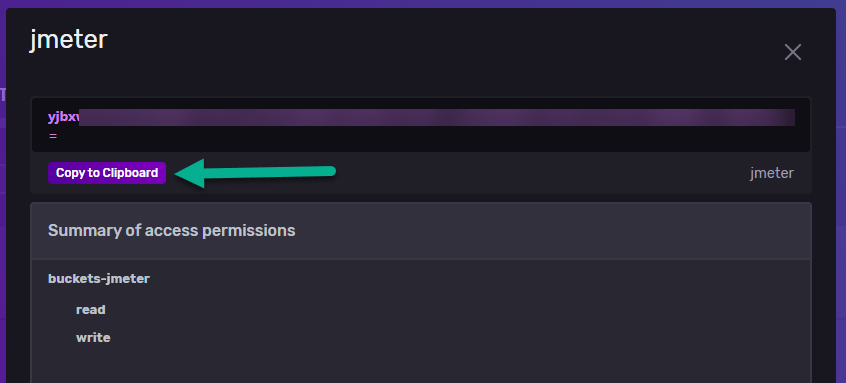
Click on the token name and then click on Copy to Clipboard.
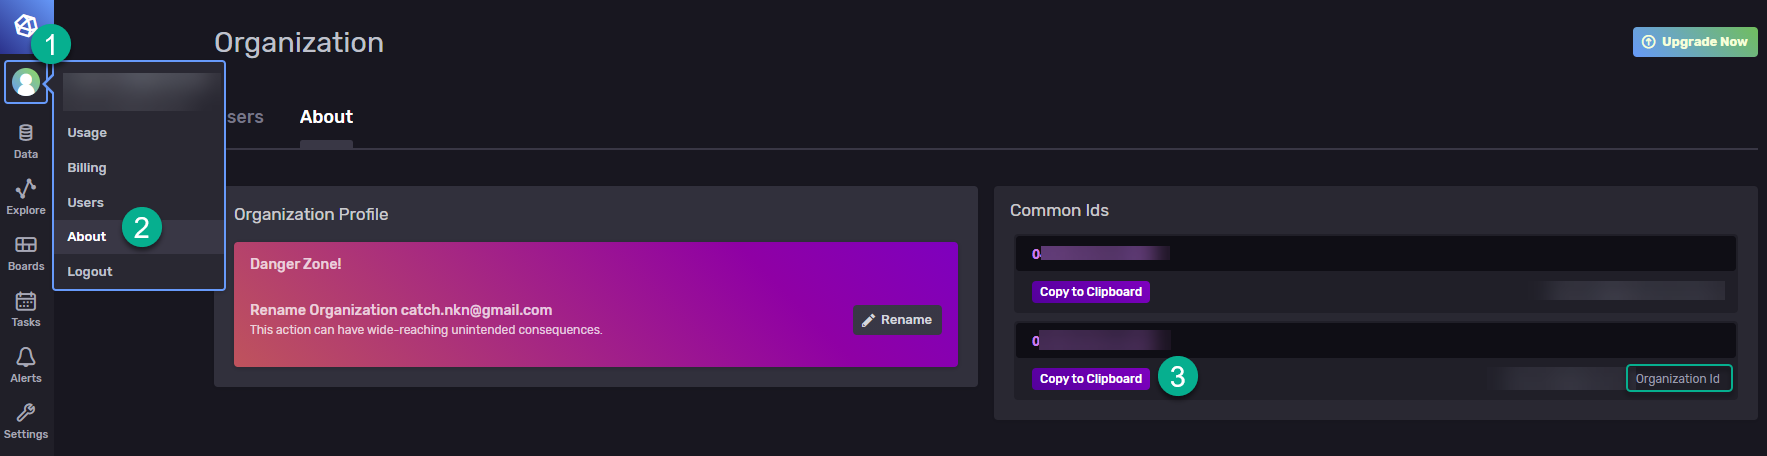
To retrieve the Organization ID, click on the Profile icon > About. Then, click on Copy to Clipboard under Organization ID section.
To retrieve the URL, just copy the domain name from the browser address bar. E.g. https://us-west-2-1.aws.cloud2.influxdata.com/
JMeter Set up
Launch JMeter, open the test plan which you are going to execute. Add a backend listener by right clicking on Thread Group > Add > Listener > Backend Listener.
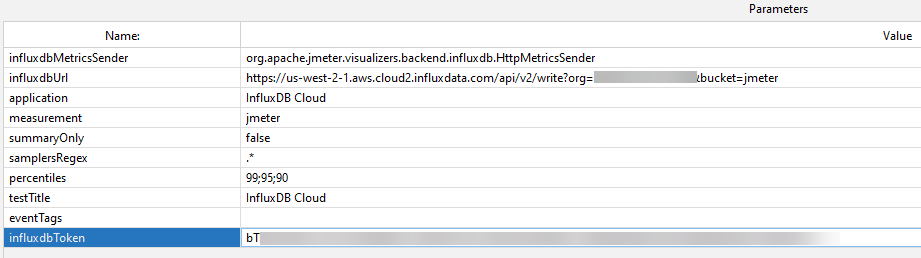
Select InfluxDBBackendListener Client as the implementation.
Add a property influxdbToken and paste the token which you created in InfluxDB Cloud.
In influxdbUrl, value of the format would be https://<influxdb_cloud_domain>/api/v2/write?org=<organization_id>&bucket=<bucket_name>. Paste the domain name, orgranization ID and the bucket name.
Below is for your reference.
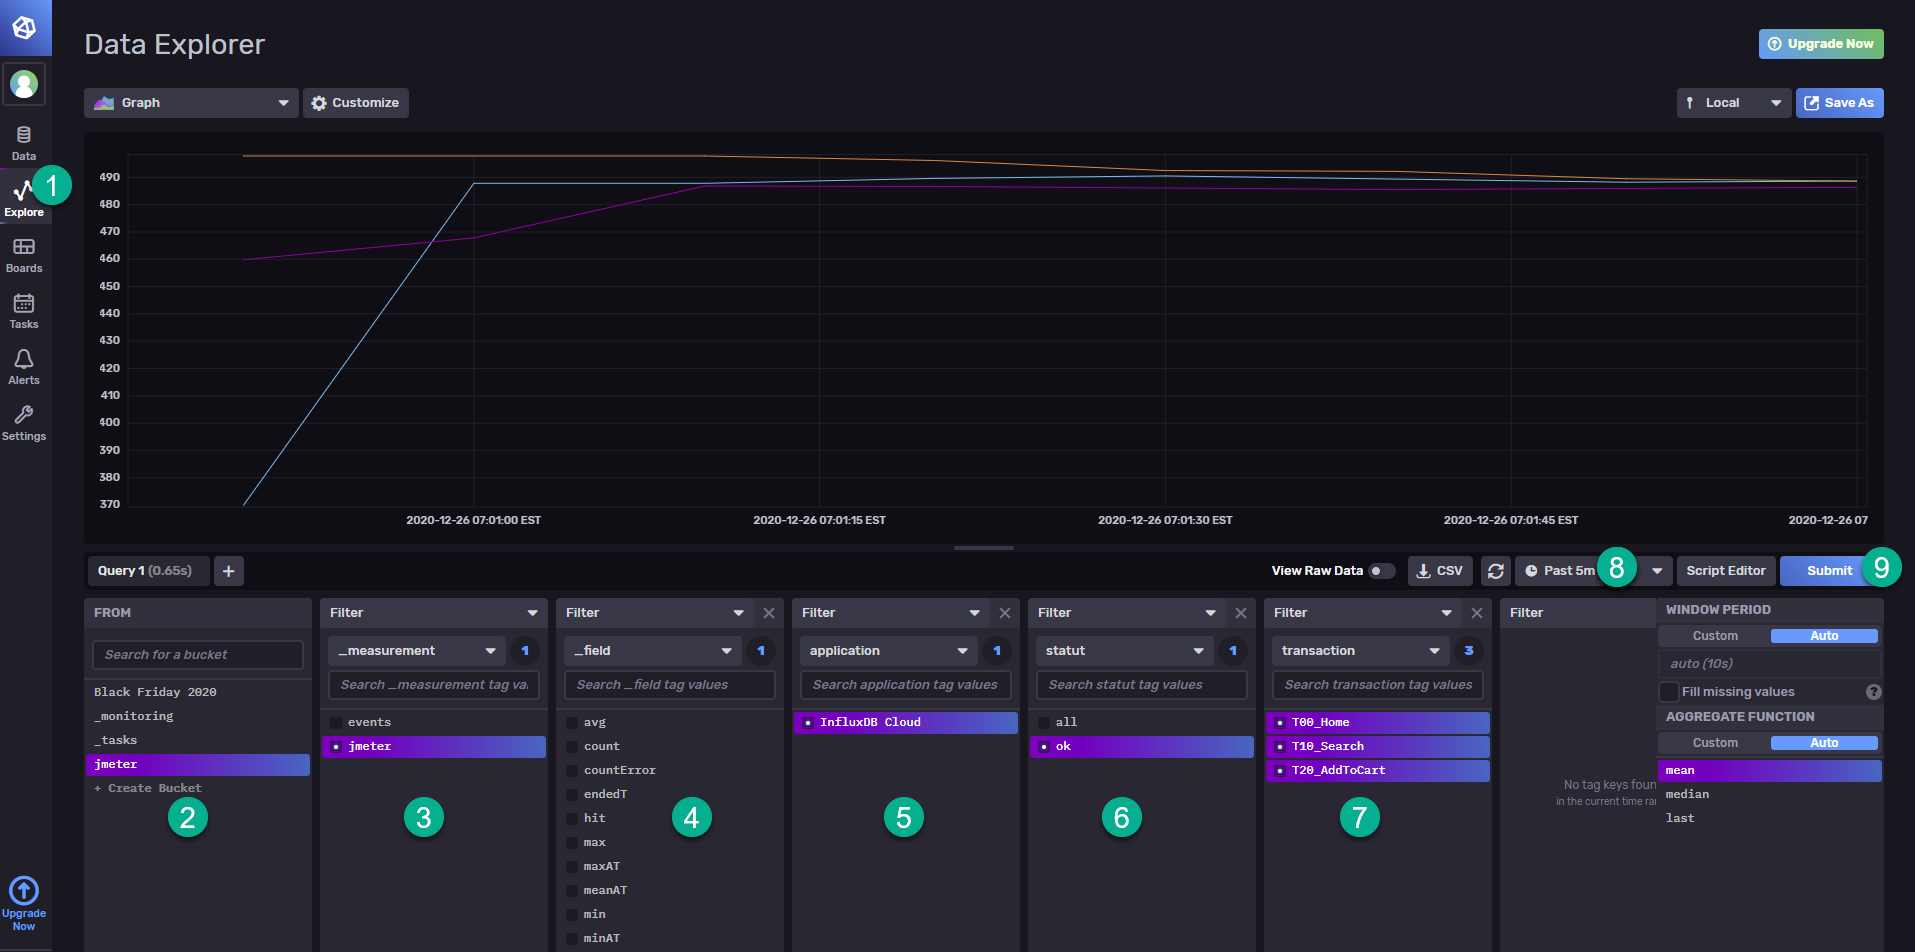
Save the test plan. Run your test in CLI mode. While the test is running, navigate to InfluxDB Cloud > Explore. Submit the query as shown below. You will see the runtime performance stats in the InfluxDB Cloud.
Grafana and InfluxDB Cloud Integration
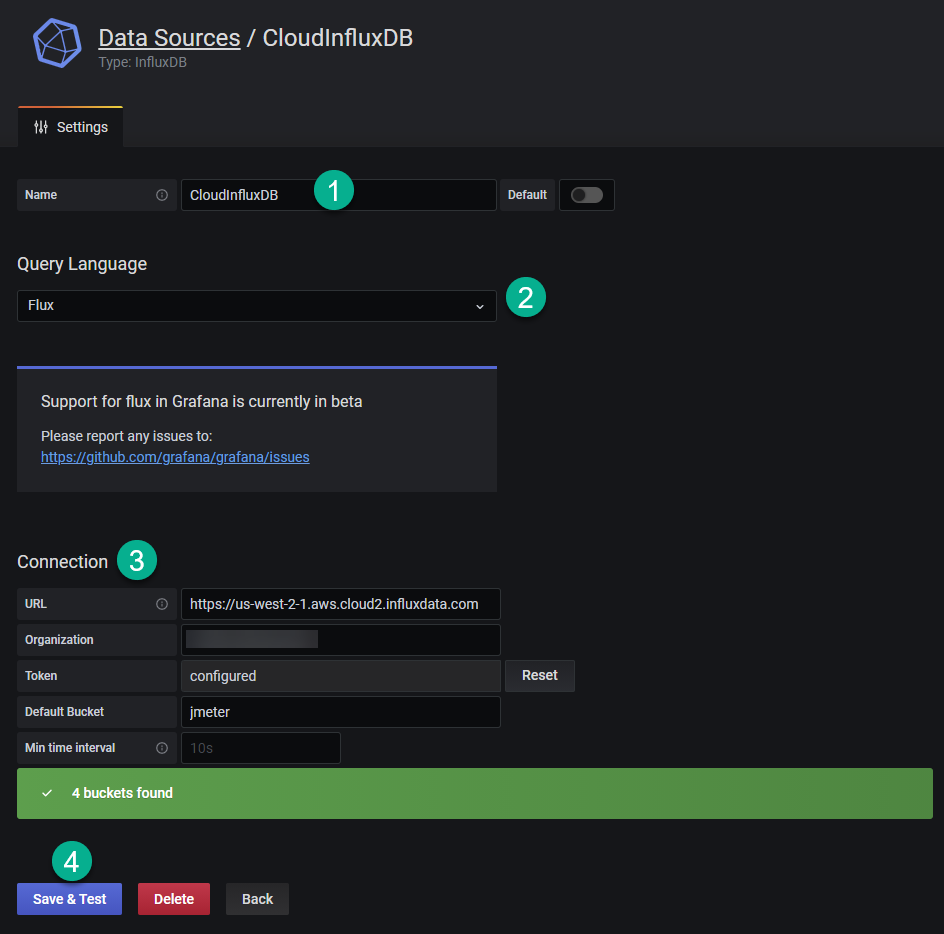
If you would like to integrate your InfluxDB Cloud with Grafana, you can do it. Launch Grafana, go to Configuration > Data Sources > Add data source. Select InfluxDB and configure the details as shown below. Click on Save & Test.
Final Words
Integrating JMeter with InfluxDB Cloud is straightforward and easy. No need to maintain your own instance of InfluxDB servers or running containers. Free tier is also available to test and try out features. I hope this tutorial helps you in learning the integration of InfluxDB and Grafana in JMeter.


Top comments (0)