Welcome to the Process Analytics monthly news 👋.
Our “always” reminder: The goal of the Process Analytics project is to provide a means to rapidly display meaningful Process Analytics components in your web pages using BPMN 2.0 notation and Open Source libraries.
In the blink of an eye, May whisked us away with an abundance of holidays (in France, May is the month of many long holiday weekends! 🤗). This month, we introduced new functionalities, including support for BPMN in color, which enables the rendering of color-modeled BPMN. We also updated our examples with the latest APIs and achieved a milestone with the publication of an article on integrating our bpmn-visualization library with pm4py.
bpmn-visualization TypeScript library
In May, we released 3 versions: 0.34.0, 0.34.1 & 0.35.0. Below are some highlights of the main features of these versions. For more details, check out the release notes.
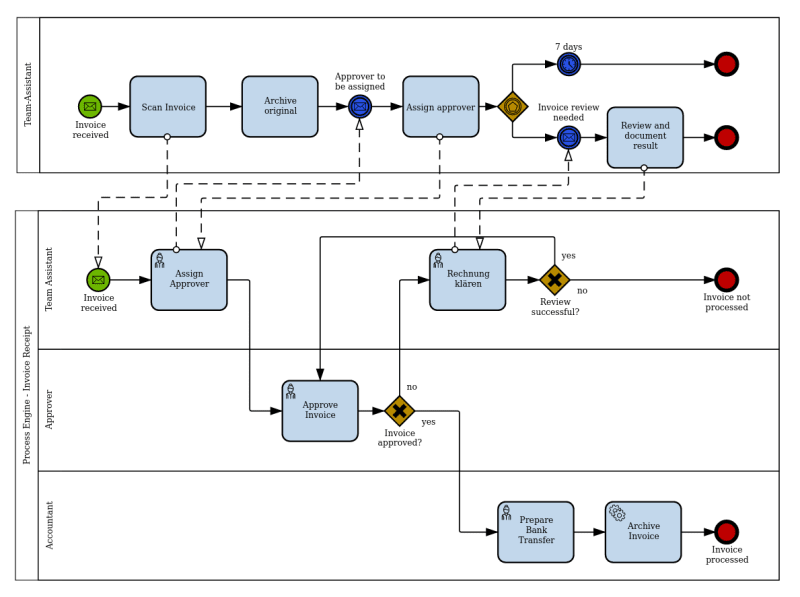
BPMN in Color specification now supported
The BPMN in Color specification is a reference to define the colors of BPMN modeling elements. This specification is recommended for color exchange between BPMN modeling tools. More information about this specification is available in the bpmn-miwg/bpmn-in-color GitHub repository.
In bpmn-visualization 0.35.0, support for BPMN in Color was introduced with a fallback to bpmn.io-specific BPMN extensions for colors.
Rendering of colors defined in the BPMN source is disabled by default. To enable BPMN in Color, use the following code snippet:
const bpmnVisualization = new BpmnVisualization({
            container: 'bpmn-container',
            renderer: { ignoreBpmnColors: false }
});
⏩ Want to test it live? Give it a try with the following examples:
- Load and navigation demo
- Example that loads diagrams from miwg-test-suite. Load A.4.1 or C.1.0 for the instance.
New API for CSS style reset
In earlier versions of bpmn-visualization, we provided functionality to remove specific classes from BPMN elements by specifying their IDs and class names, as demonstrated in the code snippet below:
// Remove CSS classes from the BPMN elements in styledElements
bpmnVisualization.bpmnElementsRegistry
                 .removeCssClasses(styledElements,
                                    ['highlight-info',
                                     'highlight-success',
                                     'highlight-error',
                                     'highlight-warning']);
While this approach served its purpose in removing a portion of CSS classes, it became cumbersome when applications required a complete restoration of default rendering or a transition to an entirely different visualization. For example, in our monitoring demo, switching from a frequency view to a time performance view, or in our Bonita Day 2023 demo, switching between different use cases necessitated a complete style reset.
With the release of bpmn-visualization 0.34.0, we introduced a new API called removeAllCssClasses in the BpmnElementsRegistry. This API empowers users to effortlessly remove all CSS classes from BPMN elements. Take a look at the code snippet below:
// Remove all CSS classes from the BPMN elements in styledElements
bpmnVisualization.bpmnElementsRegistry
                 .removeAllCssClasses(styledElements);
And if you wish to reset the CSS classes of all BPMN elements, you can simply call the function with no arguments:
// Remove all CSS classes from all BPMN elements
bpmnVisualization.bpmnElementsRegistry.removeAllCssClasses();
bpmn-visualization examples
We have updated the existing examples to showcase the enhancements of the latest functionalities. For a comprehensive overview of all the changes, please refer to the examples 0.34.0 release notes.
In particular, the monitoring demo now uses the Update Style API instead of the CSS API to have a consistent stroke width even when zooming. Curious to explore the updated demo? Take a look at our ⏩ live environment.
The examples that allow users to play with the library, and that are running in the Live IDE, have been updated as well. Want to give it a try? ⏩ live environment.
Sharing Key Insights from bpmn-visualization and pm4py Integration
We recently developed an integration example between bpmn-visualization and pm4py. This example allows the user to discover a BPMN process model from process execution data and to compute various statistics using pm4py. The results are then displayed visually using our bpmn-visualization library. The figure below showcases an example of a BPMN process model enriched with frequency data obtained from process execution data sourced from the process mining book.
During the process, we encountered some limitations of the BPMN-based process mining approach we followed ⛔️. In our latest article, we delve into the high-level details of the integration and shed light on those limitations of BPMN-based visualization in process mining. Read more about it 👉 in our Medium article.
That’s all folks!
That's a wrap for this edition of our May project news! We hope you found it informative and enjoyable. Stay tuned for more exciting updates on the horizon! 👋
In the meantime, stay on top of the latest news and releases by following us:
- Website: https://process-analytics.dev
- Twitter: @ProcessAnalyti1
- GitHub: https://github.com/process-analytics
- Discord: Join our server!
- YouTube: Process Analytics YouTube channel
Cover photo by Ricardo Gomez Angel on Unsplash


Top comments (0)