Welcome to the Process Analytics monthly news 👋.
Our “always” reminder: The goal of the Process Analytics project is to provide a means to rapidly display meaningful Process Analytics components in your web pages using BPMN 2.0 notation and Open Source libraries.
Hey there and welcome to our February monthly news! In this edition, you'll find exciting highlights from our latest release, including some new features and improvements to our bpmn-visualization TypeScript library. We've also got some news to share about upcoming events you won't want to miss. So sit back, relax 🎵, and enjoy reading through the February edition of our monthly news 📖.
Join us at Bonita Day 2023 in Paris
Save the date for Bonita Day 2023, Bonitasoft's annual event in Paris where you can discover all things BPM and get valuable feedback from our clients. This year, we'll be showcasing our "Process Analytics" project with a live demo. If you happen to be in or around Paris on March 30th, 2023, we invite you to join us for a day filled with informative sessions, expert speakers, and networking opportunities with industry professionals.
We can't wait to see you there! Register now!
If you don't want to miss events like this, please sign up for our newsletter, which is accessible from our website. Then you’ll always be informed!
Pitch at AI4BPM during AAAI 2023
We're happy to share that our project was recently pitched at the AI4BPM event, which was organized as part of the larger AI conference AAAI 2023. If you missed the event, you can still watch our video pitch. Check it out and let us know what you think!
This was a fantastic opportunity for us to showcase our project. We're grateful for the chance to participate in such a prestigious event!
Our website gets a fresh look
Our website has undergone a makeover! Overall, we find that the new design is clean and streamlined, with plenty of white space to make the content more readable. We're thrilled to share this new site with you and can't wait for you to see all the changes!
bpmnVisualizationR package
Our R package bpmnVisualizationR has been published on CRAN 🎉.
Publishing on CRAN means that the package is now available to a wider audience of R users, with increased visibility and accessibility. For more information on the package and how to use it, check out our documentation and examples.
We're always looking for ways to improve our package and make it more useful for our users. 🔌 If you have any feedback, suggestions, or feature requests for bpmnVisualizationR, we'd love to hear from you! You can reach out to us directly via our Discord channel.
bpmn-visualization TypeScript library
In February, we released 2 versions: 0.30.0 & 0.31.0.
Navigate BPMN diagrams with neighborhood information
We added a new feature that enables users to retrieve neighborhood information for BPMN elements.
The js-popover example has been updated to display this new information as shown below.
With this feature, users can easily navigate through the diagram and identify related elements, making it easier to analyze BPMN diagrams. This feature also allows for implementing advanced search functionalities.
Access to underlying mxGraph context
The library now provides access to the underlying mxGraph context. This functionality is intended for advanced users who want to customize and extend the library's functionality.
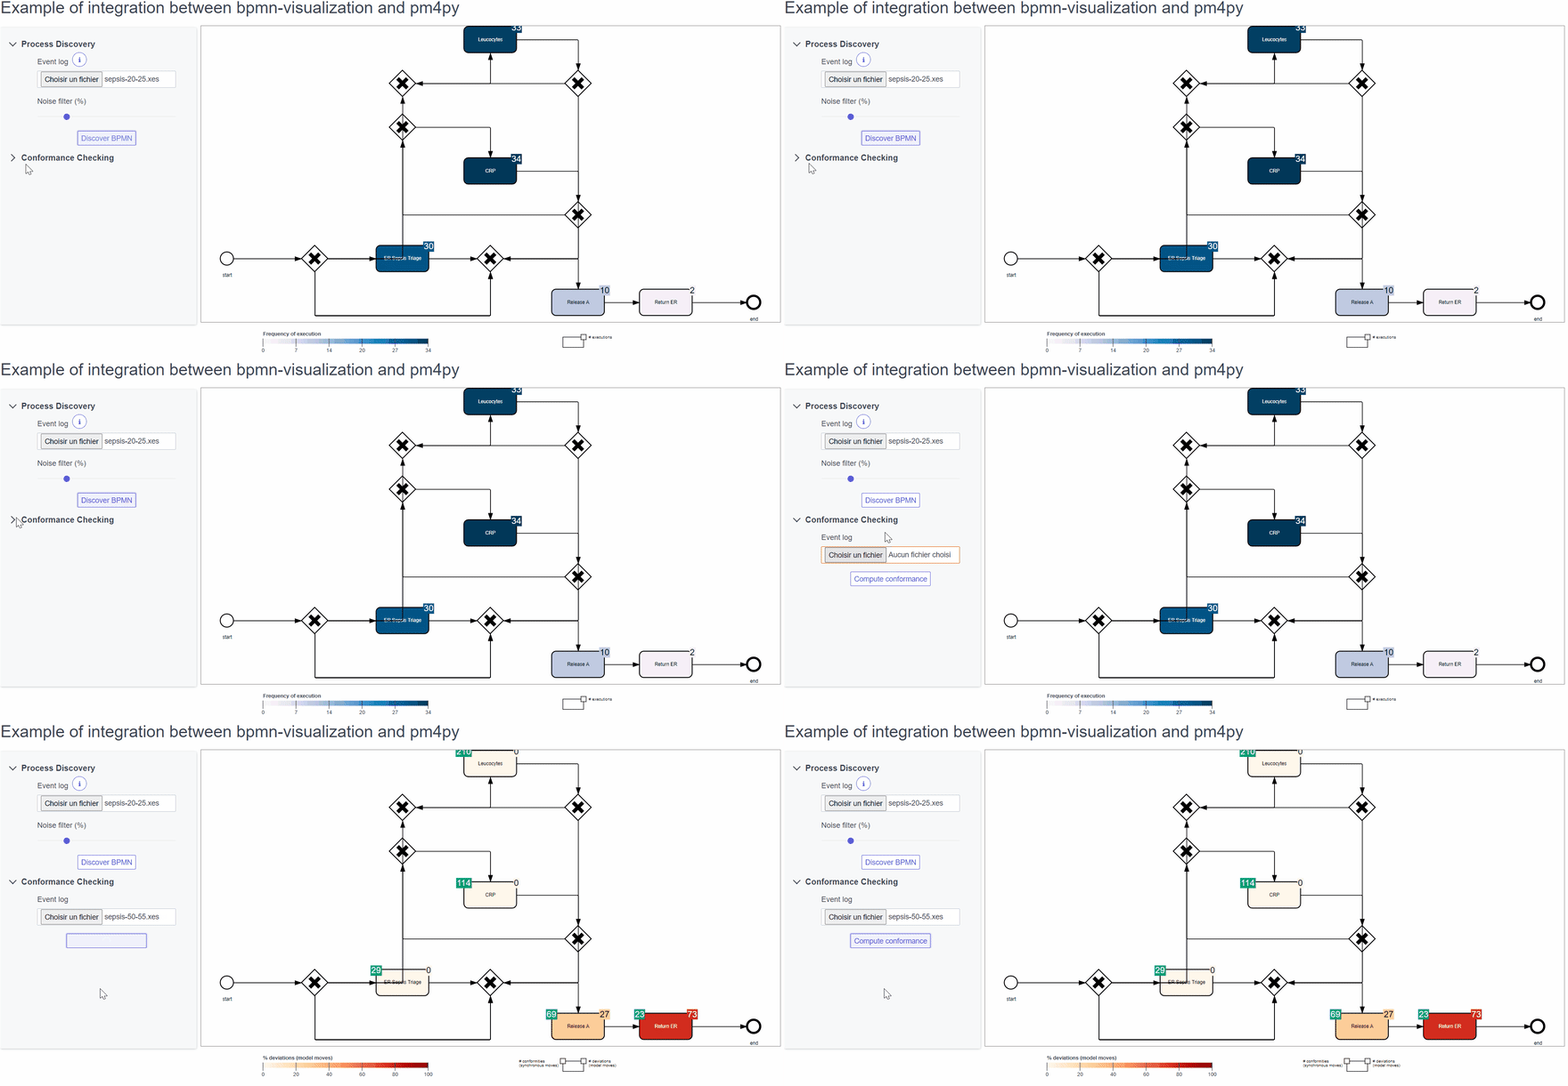
One example of where this feature comes in handy is our latest integration example with pm4py. In this example, we dynamically updated the style of BPMN elements based on data received from the backend processing by pm4py. You can see an excerpt in the gif below.
New demo for navigating a BPMN diagram
A new demo that illustrates how users can interact and navigate a BPMN diagram by highlighting two consecutive shapes is available. The demo video below shows how this feature works in action.
That’s all folks!
We hope you enjoyed this February project news and stay tuned for more updates and exciting developments in the coming months 👋!
In the meantime, stay on top of the latest news and releases by following us:
- Website: https://process-analytics.dev
- Twitter: @ProcessAnalyti1
- GitHub: https://github.com/process-analytics
- Discord: Join our server!
- YouTube: Process Analytics YouTube channel
Cover photo by Ray Hennessy on Unsplash


Top comments (0)