
Goal:
We would like to install the monitoring tool Prometheus and Grafana with helm 3 on our local machine/VM.
Prerequisites:
A Kubernetes Cluster
Local configured copy of kubectl
Install Helm 3:
Let’s install helm v3 using following commands.
$ curl -fsSL -o get_helm.sh https://raw.githubusercontent.com/helm/helm/master/scripts/get-helm-3
$ chmod 700 get_helm.sh
$ ./get_helm.sh
Helm version
$ helm version
Add repository of stable charts:
Here, we are adding stable helm charts default repository, so we can search & install stable chart from it.
$helm repo add stable https://kubernetes-charts.storage.googleapis.com
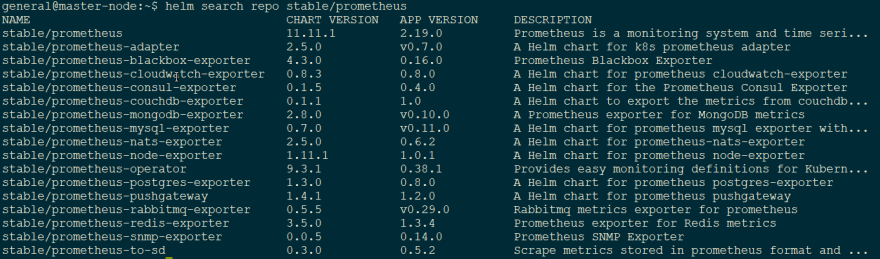
Search for the Prometheus chart:
$ helm search repo stable/prometheus
you will see something similar like this:
Here, we will install the Prometheus Operator for Kubernetes that provides easy monitoring definitions for Kubernetes services and deployment and management of Prometheus instances.
$ helm install --generate-name stable/prometheus-operator
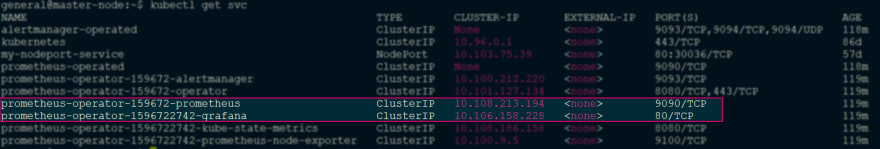
Once the chart is installed, you can check the with following commands:
$helm list
$kubectl get pods
$kubectl get svc
Since prometheus & grafana services are available within a cluster (ClusterIP is the default Kubernetes service), therefore they can not be accessed outside of cluster.
In order to access the web GUI from outside of cluster, on our local machine we need to change default ClusterIP services to NodePort (Kubernetes transparently routes incoming traffic on the NodePort to your service).
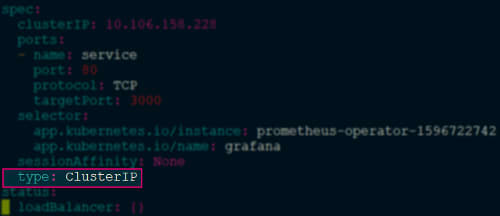
Edit Prometheus service:
$kubectl edit svc prometheus-operator-159672-prometheus
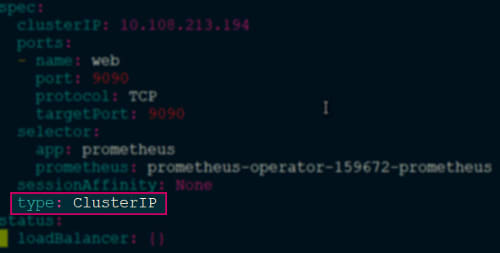
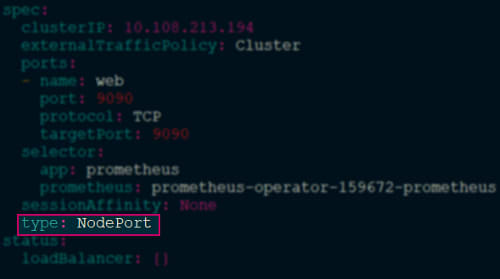
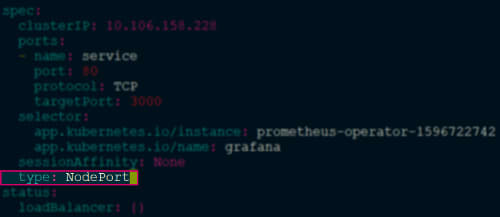
You will see this service is configured with type: ClusterIP, this needs to be changed to type: NodePort & save the file. Your service will be changed successfully.
Same for the Grafana service:
$kubectl edit svc prometheus-operator-1595722742-grafana
Note: If you are installing this chart on cloud (aws, gcp,…), you can change the type from ClusterIP to LoadBalancer. And you can access Prometheus & Grafana with public ip (external ip) which will be created after this change.
Now let’s check our changes are occurred successfully:
$kubectl get svc
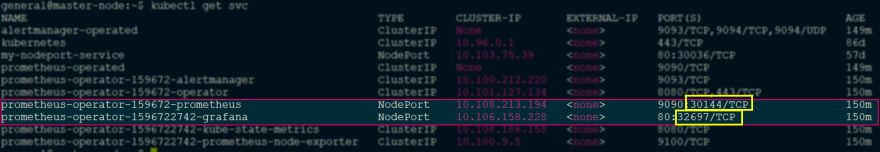
You can see both services are changed to NodePort & you can access the Web GUI with following command:
Prometheus:
localhost:30144
Grafana:
localhost:32697
Default credentials for Grafana:
username: admin
password: prom-operator


Top comments (1)
Thank you for sharing this.
I tested but prometheus could not discover any exporter and the target was blank
ip:30287/targets
Are there any extra steps to do?