This bar chart was one of the more straightforward visualizations to implement, and it was a good place for me to get my feet wet with Svelte and D3.
For reference, Nicholas Felton’s original bar chart looks like this:
Simple and effective.
In order to recreate this, several things needed to be done:
- Set up some sizing values to define the spacing of individual elements in each line.
- Calculate the height of each line, which is then used to determine the height of the SVG.
- Create a scale for the x-axis which will be used to draw both the solid and dashed lines.
- Parameterize the highlight color so that the chart can be re-used with different colors.
I’ll cover how I did these things below.
Caveats
First of all, I’m sort of assuming that you have some idea of how Svelte works. If you don’t and are curious, you can take 30 minutes to work through the Svelte Tutorial. While there are a bunch of other great resources available, I’ve found that Svelte is simple enough that the tutorial is actually a really great starting point.
Also, I’m not going to cover the details of how Svelte and D3 interact. The key takeaway is that Svelte handles reactivity and DOM manipulation, and D3 is used for things like scales, etc. Paul Butler’s YouTube series about combining D3 with Svelte is a great starting point, as are Matthias Stahl’s presentations on Svelte and D3 and How do you set up visualization with Svelte.
SVG Sizing and Some CSS Gymnastics
In order to create an SVG that will maintain its aspect ratio when placed into containers of various sizes, you need to use a viewBox attribute to set the coordinate system of the SVG. This had to be one of the most confusing things I ran into when getting started. In fact, I’m still not sure that I have completely internalized the specifics of how SVG sizing/scaling works, so I’ll simply refer you to the resources I used to get started:
- Understanding SVG Coordinate Systems and Transformations ( amazing )
- How to Scale SVG
- SVG: Font Size
So, one of the first things I needed to do was calculate the height of the overall bar chart based on its contents. I ended up explicitly setting the font size in my TypeScript code and using that to perform calculations with the text height, like calculating offsets, line heights, etc.
// Sizing in SVG user space
const width = 1200;
// Font size in user space
let textHeight = 30;
This needs to be made available to the CSS, but because Svelte doesn’t perform template substitution within the CSS <style> section, you need to do a little hoop jumping to get things to work. You can add a style attribute on the SVG (or any container) that defines CSS custom properties, like so:
<svg style="--label-size: {textHeight}px; --highlight-color: {highlightColor};">
  ...
</svg>
Once you’ve done this you can write CSS that uses those variables in your <style> section:
<style>
svg {
  width: 100%;
  height: auto;
}
.label {
  font-size: var(--label-size);
}
.highlight {
  fill: var(--highlight-color);
  stroke: var(--highlight-color);
  font-weight: bold;
}
.measure {
  stroke-width: 5px;
}
.dash {
  stroke-dasharray: 4px 12px;
  stroke-width: 3px;
}
</style>
This makes it straightforward to change the font size if I’m using the chart in a different context. You can even make textHeight a Svelte component property and pass it in as necessary. That said, ideally I’d be able to control all of this styling via CSS, so I’m still trying to figure out if you can do that. If you have suggestions on how to better manage consistent font sizes across both CSS and SVG text elements, please let me know.
Calculating the SVG Height
Okay, so with the textHeight available, we can calculate the height of an individual line, and then the overall SVG height.
Each line in the visualization is comprised of two parts: the name and metric value on top, and the bar visualization of the metric value below. The spacing of a line is the height of the text line plus some padding below the text that contains the bar visualization. I used linePadding and barOffset to keep track of these spacing elements.
// Margins within the SVG
let margins = {
  top: 50,
  bottom: 50,
  left: 50,
  right: 50,
};

// How many lines should be displayed?
const topN = 10;

// Space between the bottom of the text and the next line
const linePadding = 40;

// Space between the bottom of the text and the metric bar
// *must be less than linePadding*
const barOffset = 15;
const lineHeight = textHeight + linePadding;

// Compute the overall height
const height = topN * lineHeight + margins.top + margins.bottom;
Once we’ve calculated the height we can finally add the viewBox attribute to set the aspect ratio of the SVG.
<svg viewBox="0 0 {width} {height}">
  ...
</svg>
💣 One thing to keep in mind with SVGs is that the x-axis runs from left to right, but the y-axis runs from top to bottom, opposite of the coordinate system that most of us were taught in geometry. That means that (0, 0) is in the upper-left part of the SVG, and (100, 100) will be in the lower right. While not really a problem for this simple chart, this definitely messed with my head on another chart that had multiple y-axes pointing in different directions.
Drawing the Data
Now we can move on to drawing the elements of the bar chart. The structure of the data that I used in this example is as follows:
const data = [
  {
    name: "Elias Vančo",
    total_actions: 260,
  },
  {
    name: "Sommer Wolfe",
    total_actions: 337,
  },
  ...
];
Many D3 functions take accessor functions for data arrays, so I like to declare helper functions to access individual data elements so that I can easily change them later, if necessary.1
const metricAccessor = (d) => d.total_actions;
const titleAccessor = (d) => d.name;
Creating the X-Axis Scale
D3 makes it easy to map values in your data domain to the coordinate system of the SVG (the range) through the use of scales. There are a number of different scales from which to choose, and for this visual I used scaleLinear to perform a basic linear mapping from domain to range.
import * as d3 from "d3";

// Grab the maximum value from the data for later use
const xMax = d3.max(data, metricAccessor);

// Create a D3 scale that maps domain values (from 0 to xMax)
// to SVG coordinates, respecting margins
const xScale = d3
  .scaleLinear()
  .domain([0, xMax])
  .range([margins.left, width - margins.right]);

// Calculate the index-based offset from the top of the SVG
// Note: Add textHeight to shift text below the starting point
// as text is placed according the the baseline
const yOffsetFn = (i) => lineHeight * i + margins.top + textHeight;
xScale is a function that calculates the absolute x-axis SVG positions for any data value in the domain. yOffsetFn serves the same purpose as xScale but calculates an index-based vertical offset for the y-axis to be used for line spacing.
Creating the Bar Elements
Once I had a scale that mapped domain values to SVG coordinates, I could iterate through the data to draw the bar chart.
First, I sorted the data and pulled the topN values into a separate variable using Ramda.
import * as R from "ramda";
// Sort and extract the first topN elements from the sorted collection
const diff = (a, b) => metricAccessor(b) - metricAccessor(a);
const topParticipants = R.take(topN, R.sort(diff, data));
I then used the Svelte #each construct to iterate through the topParticipants collection to generate SVG elements. In these elements I made use of the xScale and yOffsetFn functions to calculate absolute SVG positions.
<svg ...>
{#each topParticipants as participant, i}
  <text
    class="label"
    text-anchor="start"
    x={xScale(0)}
    y={yOffsetFn(i)}
  >{titleAccessor(participant)}</text>
  <text
    class="label highlight"
    text-anchor="end"
    x={xScale(xMax)}
    y={yOffsetFn(i)}
  >{metricAccessor(participant)}</text>
  <line
    class="dash"
    x1={xScale(0)}
    x2={xScale(xMax)}
    y1={yOffsetFn(i) + barOffset}
    y2={yOffsetFn(i) + barOffset}
  />
  <line
    class="measure highlight"
    x1={xScale(0)}
    x2={xScale(metricAccessor(participant))}
    y1={yOffsetFn(i) + barOffset}
    y2={yOffsetFn(i) + barOffset}
  />
{/each}
</svg>
The first text element is the left-aligned participant name, using xScale(0) for the x position.
The second text element is the right-aligned count of total actions. To do this I needed to calculate the maximum x position via xScale(xMax), and set the text-anchor attribute of the text element to end. That moved the element all the way to the right, but lined up the end of the text with the provided x coordinate.
The first line element is the dashed-line placeholder for the measure. The y position is offset by the additional barOffset to give the text above it a little breathing room. This line is drawn across the entire x-axis to produce visually consistent dashed lines across the entire chart. Since SVG elements are drawn in the order they are defined, with later elements overlapping earlier ones, this placeholder is hidden by the next element and there are no fancy line start/end calculations required.
The second line element is the bar representing the actual measure. It is drawn on the same y position as the previous line, but is slightly thicker to completely obscure the dashed line.
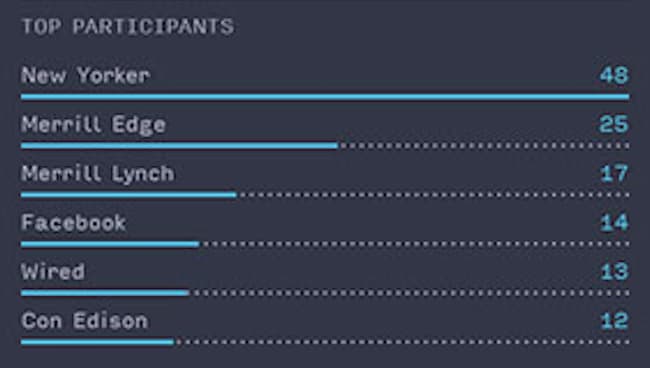
Once all of these elements were in place the entire visual was basically done. I did notice one detail that bothered me after a quick visual inspection:

The final dot at the end of the dashed placeholder lines didn’t match up to the right end of the scale. This was easily remedied by drawing the dashed line from right to left instead of left to right (by swapping the x1 and x2 values), which resulted in any left side alignment issues being hidden under the metric bars.
Here’s the final result:

The code I used to write this post is available on GitHub.
Please feel free to contact me if you have any questions or comments.
-
If this were really a general purpose chart library, you’d need to pass these functions in to this component, in the same way that generic sorting algorithms take comparison function parameters. ↩︎


Top comments (0)