
A graph is a structure that represents the connections between objects. They can be used for social network analysis, working out someone's Erdős number, finding the shortest path through a maze, and many other applications.
We'll be calculating the path between two countries with the least border crossings. The method we'll use is Breadth-First Search (BFS).
What's in a Graph?
Graphs are made up of vertices and edges. Below is the representation of France and its land border crossings.

An example of a vertex is FR or DE — they are also known as points or nodes. Here they represent countries.
An example of an edge is {FR, IT} or {FR, BE} — they are also known as lines, links, or connections. Here they represent the land border crossing between two countries.
Let's build a slightly more complicated graph. If our goal is to find the shortest path between two countries then we need a structure containing all of the countries of the world. We'll actually need multiple graphs because some sets of countries aren't connected to other sets of countries (and islands are just lone vertices).
All the code for this post can be found on healeycodes/country-borders.
We can get all the data we need from borders.csv. This file is structured as country_code, country_name, country_border_code, country_border_name.
As a side-quest, we'll also store a relationship between country codes and their full names to make our output more user-friendly later on.
import csv

country_border_graph = {}
country_code_lookup = {}

with open('borders.csv') as csvfile:
    reader = csv.reader(csvfile, delimiter=',')
    next(reader, None)  # skip the headers
    for row in reader:
        country_code_lookup[row[0]] = row[1]
        country_a = row[0]
        country_b = row[2]

        if country_a in country_border_graph:
            country_border_graph[country_a].append(country_b)
        else:
            country_border_graph[country_a] = [country_b]
A graph is a mathematical structure and there is no singular way to represent them in code. Here, we have chosen a dictionary that maps a country to a list of its neighbors.
If we isolate France inside country_border_graph, it looks like this:
{
    'FR': ['AD', 'BE', 'DE', 'IT', 'LU', 'MC', 'ES', 'CH']
}
Displaying Graphs
So how do we print this to the screen? First we alter the structure of our data then we plug it into some libraries.
In order to build a DataFrame for the pandas library, we need to create two lists that describe all of our edges. We do that by iterating through the structure and adding a vertex to two lists (from_verts and to_verts) when we want to describe a connection.
from_verts = []
to_verts = []
for country in country_border_graph:
    for i in range(0, len(country_border_graph[country])):
        if country_border_graph[country][0] == '':
            # skip islands
            continue
        from_verts.append(country)
        to_verts.append(country_border_graph[country][i])
For France, the lists would look like this:
# from_verts
['FR', 'FR', 'FR', 'FR', 'FR', 'FR', 'FR', 'FR']

# to_verts
['AD', 'BE', 'DE', 'IT', 'LU', 'MC', 'ES', 'CH']
Using pandas, networkx, and matplotlib we can display our non-islands in a popout window.
import pandas as pd
import networkx as nx
import matplotlib.pyplot as plt


def show(from_verts, to_verts):
    df = pd.DataFrame(
        {'from': from_verts, 'to': to_verts})
    G = nx.from_pandas_edgelist(df, 'from', 'to')

    nx.draw(G,
            with_labels=True,
            node_size=1500,
            node_color="skyblue",
            node_shape="o",
            linewidths=4,
            font_size=25,
            font_color="grey",
            font_weight="bold",
            width=4,
            edge_color="grey",
            dpi=1000)
    plt.show()
The result is below. (I briefly attempted to visually unsquish the vertices from each other but didn't think it was worth the effort. If you want to display this data more aesthetically, start by checking out this StackOverflow answer.)
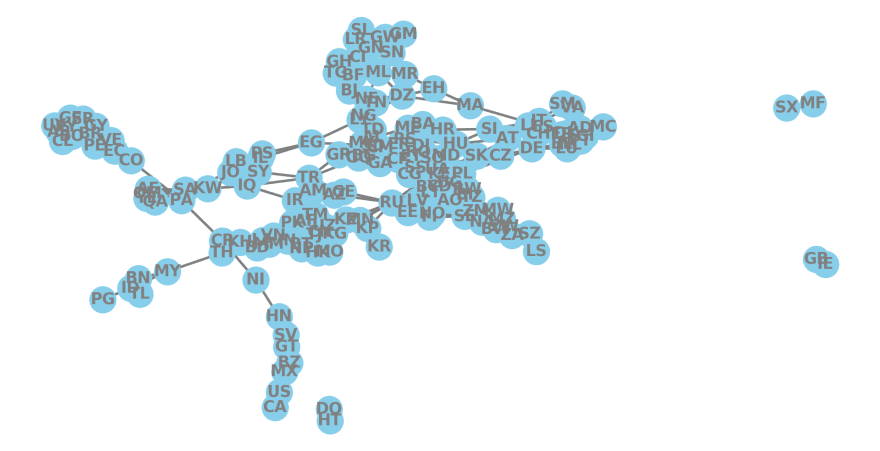
While this image, at first glance, looks similar to a world map the positions of the countries are not tied to their position on Earth.
Shortest paths
You can calculate the shortest path between some countries by hand. Take the path from Canada to Mexico as an example. At the lowest point of the largest set in the above image, we can see that CA is connected to US which is connected to MX. It's clear there is only one route between Canada and Mexico and therefore we have found the shortest path.
What if there are multiple paths? Let's take the path from France to China as an example.
Breadth-First Search (BFS) works by first looking at all of the nearby vertices and then working further and further away from the start point. By using FR as a starting point, our algorithm will first check ['AD', 'BE', 'DE', 'IT', 'LU', 'MC', 'ES', 'CH']. When it doesn't find China among those, it will then look at the neighbors of AD and then the neighbors of BE and so on.
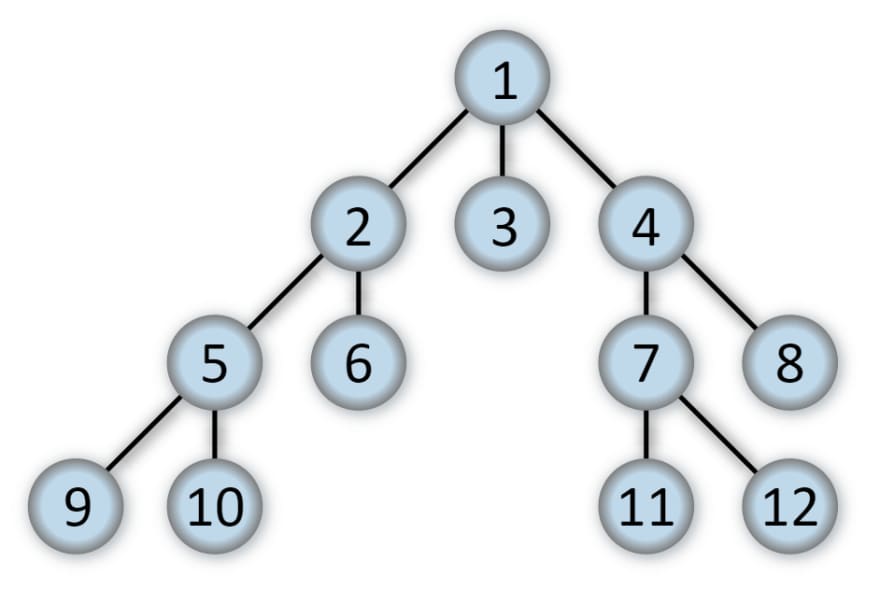
In the diagram below, we can see the order in which BFS would visit each vertex of a tree.
The algorithm we use has been adapted from an outdated essay on Python.org. Eryk Kopczyński corrected the efficiency of the essay's pathing function ten years after its publication date. In linear time, it computes and stores the direct paths from the start point to every other point and then returns the path from the start point to the endpoint.
His original code returns the path in a strange format. FR to CN is [[[[['FR'], 'DE'], 'PL'], 'RU'], 'CN']. We can unfurl this nested list with flatten.
from collections import Iterable


def flatten(l):
    # flatten a nested list
    # https://stackoverflow.com/a/2158532

    for el in l:
        if isinstance(el, Iterable) and not isinstance(el, (str, bytes)):
            yield from flatten(el)
        else:
            yield el


def find_shortest_path(graph, start, end):
    # breadth first search (BFS)
    # adapted from https://www.python.org/doc/essays/graphs/

    dist = {start: [start]}
    q = [start]
    while len(q):
        at = q.pop(0)
        for country in graph[at]:
            if country not in dist:
                dist[country] = [dist[at], country]
                q.append(country)

    raw_path = dist.get(end)
    return list(flatten(dist.get(end)))
We can use this function on the original country_border_graph dictionary we built. With the country_code_lookup we made, we can print out user-friendly information.
france = country_border_graph["FR"]
france_names = [country_code_lookup[code] for code in france]

print(f'France is connected to {len(france_names)} countries.')
print(f'They are {", ".join(france_names)}.')

path = find_shortest_path(country_border_graph, 'FR', 'CN')
path_names = [country_code_lookup[code] for code in path]

print(f'The shortest path from France to China is: {" -> ".join(path_names)}.')
This prints:
France is connected to 8 countries.
They are Andorra, Belgium, Germany, Italy, Luxembourg, Monaco, Spain, Switzerland.
The shortest path from France to China is: France -> Germany -> Poland -> Russian Federation -> China.
To display this path, we can use the show function we defined earlier.
path = find_shortest_path(country_border_graph, 'FR', 'CN')

from_verts = []
to_verts = []
for i in range(1, len(path)):
    # we're drawing a line
    # so we describe each edge
    from_verts.append(path[i-1])
    to_verts.append(path[i])

graph.show(from_verts, to_verts)

We can now visually show the shortest path between any two connected countries.
(If we attempted to use this code to calculate the path between two non-connected countries, e.g. GB and CN, the code would throw an error. Let's blame geography for this instead of the code's author.)
Thanks to Alexander Drichel for the Breadth-First Tree diagram.
Join 300+ people signed up to my newsletter about code and how I write it!
I tweet about tech @healeycodes.

Top comments (2)
This is so much fun! Could be a great CS assignment. :)
Thanks Richard!
I would have loved this at university. I believe the classic graph homework is plane routes ✈️