I realized I was asking Google Assistant the same questions over and over again. Like What's the current weather? or What's on my calendar for today? So I set out to build a small dashboard for my Raspberry Pi that I could check instead.
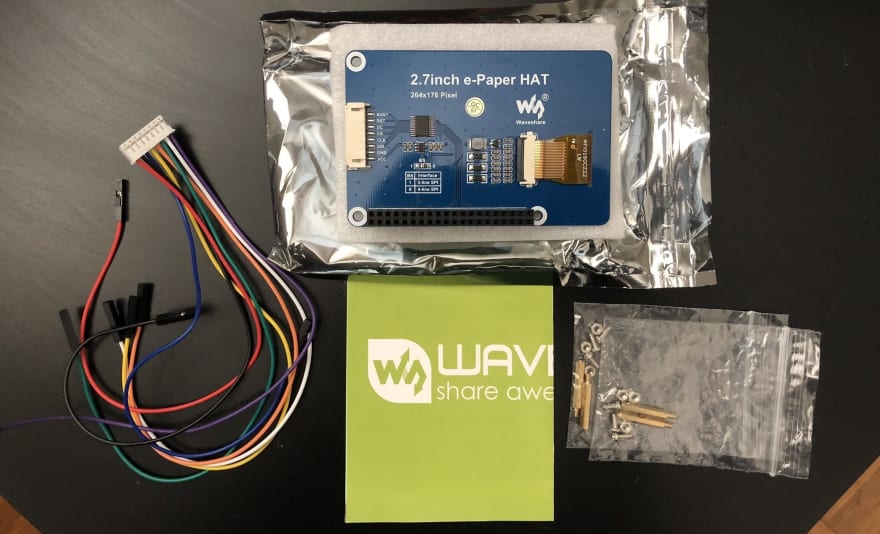
I bought a Waveshare 2.7inch e-Paper HAT (B) for ~$20. This version comes with a printed circuit board that slots right onto the general-purpose input/output (GPIO) pins of a Raspberry Pi. You can also use the included wires to avoid blocking the unused GPIO pins.
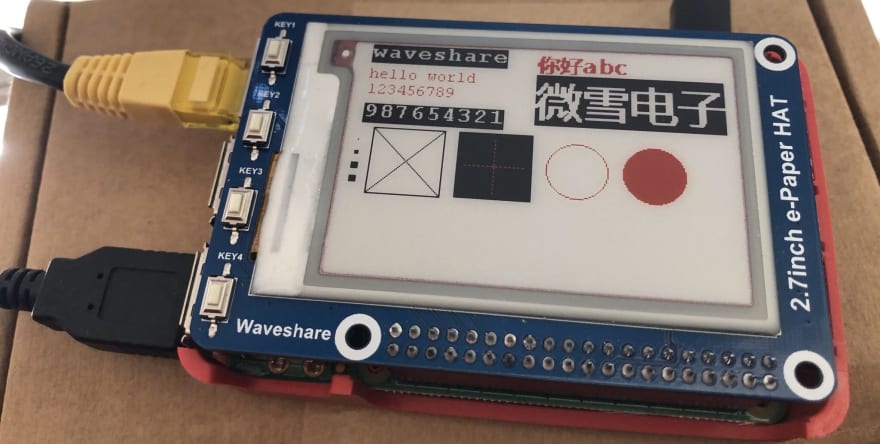
I followed the installation instructions from the Waveshare wiki and fired up one of the hello world programs — there are versions in C and Python. The steps to get this going, as well as the example programs, are quite accessible compared to other Raspberry Pi hardware accessories.
I started picking through the source code of the Python examples to understand how epd-library works. The version B of this screen is tri-colored, it can display white, black, and red, and the resolution is 264x176. The examples start by clearing the screen (filling it with white) and then create two layers which are Image objects from the Pillow library. One of the layers is the black content and the other layer is the red content. These are then passed to the render function EPD::display.
I've extracted and commented the key parts of examples/epd_2in7b_test.py.
# initialize the EPD class
epd = epd2in7b.EPD()
epd.init()

# start with a clear (white) background
epd.Clear()

# define a simple font
font24 = ImageFont.truetype(os.path.join(picdir, 'Font.ttc'), 24)

# create empty image objects/layers
HBlackimage = Image.new('1', (epd.height, epd.width), 255)
HRedimage = Image.new('1', (epd.height, epd.width), 255)

# render the black section
black_draw = ImageDraw.Draw(HBlackImage)
black_draw.text((1, 1), top_text, font=FONT_LARGER, fill=0)

# calculate the depth of the black section
top_depth = black_draw.textsize(top_text, font=FONT_LARGER)[1] + 5

# render the red section under the black section
red_draw = ImageDraw.Draw(HRedImage)
red_draw.text((1, top_depth), bottom_text, font=FONT_SMALLER, fill=0)

epd.display(epd.getbuffer(HBlackImage), epd.getbuffer(HRedImage))
For the prototype, I'll show the current weather and some news headlines from the BBC. Open Weather and News API both have generous free-tiers. For each of these features, I'll write functions that return text which I can create layers from.
I'll be using formatted strings from Python 3.5 (as opposed to the superior f-strings) because that's what Raspian (the default Raspberry Pi operating system) comes with.
This function talks to Open Weather using PyOWM, a wrapper library.
def get_weather():
    '''
    Get the formatted weather description.
    E.g. `Richmond, GB: Clear sky`
    '''
    owm = pyowm.OWM(OPEN_WEATHER_KEY)
    observation = owm.weather_at_place(LOCATION)
    w = observation.get_weather()
    detailed = w.get_detailed_status().capitalize()

    temp_data = w.get_temperature('celsius')
    current_temp = str(temp_data["temp"])
    min_temp = str(temp_data["temp_min"])
    max_temp = str(temp_data["temp_max"])
    text = '{}: {}\n{}°C ({}°C - {}°C)'

    return text.format(LOCATION, detailed, current_temp, min_temp, max_temp)
News API sadly doesn't have an up-to-date library available so I use requests to make an HTTP call and parse the data. I can display about three headlines (including an extra wrapped line for each). The text needs to be manually wrapped to stop it going off-screen.
def get_news(limit=3):
    '''
    Get some news headlines from the BBC formatted in a list.
    E.g. `- Acclaimed Swedish author Per Olov Enquist dies
    - PM's return to work 'a boost for the country'
    - 'Myth that Sweden has not taken serious steps'`
    '''
    url = 'https://newsapi.org/v2/top-headlines?sources=bbc-news&apiKey={}'.format(NEWS_API_KEY)
    resp = requests.get(url=url)
    data = resp.json()
    articles = [article['title'] for article in data['articles'][:limit]]

    wrapper = textwrap.TextWrapper(width=33)
    text = ''
    for headline in articles:
        text += '- {}\n'.format(wrapper.fill(text=headline))
    return '{}\n'.format(text)
With these two sections of text, I create the image layers. I want the weather to be on the black-colored layer with a slightly larger font. The news will be underneath on the red-colored layer. Here's a function that takes an instance of the EPD class as well as two sections of text.
def show_text(epd, top_text='', bottom_text=''):
    '''
    Given an EPD instance, and sections of text, render the text.
    '''
    HBlackImage = Image.new('1', (epd2in7b.EPD_HEIGHT, epd2in7b.EPD_WIDTH), 255)
    HRedImage = Image.new('1', (epd2in7b.EPD_HEIGHT, epd2in7b.EPD_WIDTH), 255)

    # render the black section
    black_draw = ImageDraw.Draw(HBlackImage)
    black_draw.text((1, 1), top_text, font=FONT_LARGER, fill=0)

    # calculate the depth of the black section
    top_depth = black_draw.textsize(top_text, font=FONT_LARGER)[1] + 5

    # render the red section under the black section
    red_draw = ImageDraw.Draw(HRedImage)
    red_draw.text((1, top_depth), bottom_text, font=FONT_SMALLER, fill=0)

    epd.display(epd.getbuffer(HBlackImage), epd.getbuffer(HRedImage))
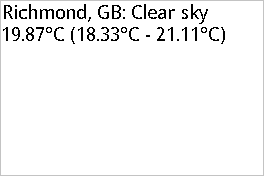
The two Image objects contain simple data and don't 'know' what color they are. They look like this when rendered to bitmap format.
Notice the space that the second layer leaves for the first layer so that the text doesn't overlap.
The main function of this program makes sure that we only display the dashboard during hours when someone will be awake. I want to avoid ghosting which the documentation warns about. The EPD class that gets passed to the show_text function is initialized here.
def main():
    try:
        epd = epd2in7b.EPD()
        logging.info("Init and Clear")
        epd.init()
        epd.Clear()


        show_text(epd, top_text=get_weather(), bottom_text=get_news())

        # leave the dashboard up for half an hour
        time.sleep(60*30)

        logging.info("Clear...")
        epd.init()
        epd.Clear()

    except IOError as e:
        logging.info(e)
        sys.exit()

    except KeyboardInterrupt:
        logging.info("ctrl + c:")
        epd2in7b.epdconfig.module_exit()
        sys.exit()

while True:
    t = datetime.datetime.now()

    # rest the screen outside this range
    if 7 <= t.hour <= 22:
        # update the dashboard
        main()
    else:
        time.sleep(30)
Let's see it in action!
I'm not sure if I'll flesh this prototype out into an open source project so for now the full source code is in a gist.
Final thoughts
I didn't invest any time in working with the four buttons on the left of the screen (they're labelled KEY1, KEY2, etc. in the above picture) but I think it would be worthwhile to integrate them in a fleshed out dashboard — they connect as standard GPIO buttons.
I've learned that e-ink screens are worth the investment for me and I might look into getting a much larger version. The viewing angle is like that of a Kindle and although it's small it's beautiful to look at and has a more 'real' feel than a laptop or smartwatch screen.
I look forward to seeing this technology progress and the commercial applications that arise. I saw that Whole Foods Market were using them in-store back in 2016. It would be nice to have less LEDs staring at me whenever I leave the house!
Join 250+ people signed up to my newsletter on programming and personal growth!
I tweet about code @healeycodes.


Top comments (0)