What is regression ?
Regression is a technique used to model and analyse relationships between the features and the dependent variable.
To know more about features and dependent variables, they are concepts under data preprocessing, refer the below link to get more information : https://dev.to/hariraghupathy/data-preprocessing-4mhk
There are many types of regression, we will focus only about linear regression in this post.
What is linear regression ?
This regression model tries to plot the relationship between a group of features and a dependent variable by fitting a linear equation to the observed data. Formula for simple linear regression is given below.
y = b0 + b1*x1
In the above equation :
Y is the dependent variable, for example how does a persons Salary change based on the work experience, in that case y would be the dependent variable. X is the independent variable(feature variable), in a simple linear regression we have one independent variable, this is the variable that is causing the dependent variable to change.
b1 is the coefficient for the independent variable. We cannot say that the change in X is directly proportional to the change in Y. The change also depends on the coefficient.
b0 is the constant term.
Let's think of a graph with the X and Y axes, the X axes will hold the experience count and the Y axes will hold the salary count (outcome), we wan't to know how platelet count depends on the age. If we plot the values in our dataset, we may get random plots over the graph. Our equation becomes Salary = b0 + b1 * Experience
What the above formula means is that we are just putting a line through the graph that best fits the plots. It is quite hard to draw a line to best fit the individual plots.
What is a constant ?
A constant is the point where the line crosses the variable axis. It means that when the age is 0, the equation will become Salary = b0 + b1 * experience, and finally it will hold the constant value. This is the place where the line crosses the variable axis. It means that in the above graph a person with zero years of work experience will get a salary of 30k dollars.

What is b1 ?
b1 is the slope of the line, the more steeper the line, the more salary you will get. Let's take the example where a person has 6 to 7 years of experience, then the salary will increase with respect to the slope, if the slope is less, then the salary increase will be less.

How to draw the best fit line ?
Let's take the graph with the plots, and draws some vertical lines from the actual observations (plots) to the model(line) as in the below image.

The red plus symbol is the place where the person is present in terms of salary. The model line (black line) states where that person should be present according to the model in terms of salary, and according to the model it should be somewhere very near to the model line, for example if the actual observation is 200000 dollars, according to the model it should be somewhat lower and nearer to the model line say 180000 dollars.
The red plus symbol is yi and that is the actual observation, the green plus symbol is yi^ and that is the value with respect to the model (modelled value), and hence the green dotted line is actually the difference between what he is actually earning and what he is modelled to be earning.
To get the best fitting line, we take each of the green lines, square them, and we will take the sum of those squares, and we take the minimum. So a simple linear regression draws lot of green lines as in the above image, and counts the sum of those squares every single time and stores it somewhere and then finds the minimum from those values. It looks for the minimum sum of squares. The line which has the smallest sum of squares will be the best fitting line. This is called the ordinary least squares method.
Implementation
Consider a dataset with the following columns age and salary, age is the feature variable and salary is the dependent variable. Each row of the dataset corresponds to different people. So for each person, we have the age and the salary data. The outcome is to build a simple linear regression model, that will be trained to understand the correlations between the age and the salary, so that it can predict the salary for a new person in an organisation based on the age.
age     Salary
21      450000
45      4000000
18      300000
30      1000000
60      8000000
70      1000000
75      2000000
38      1500000
45      2000000
88      10000000
Step 1: Importing the libraries :
import numpy as np
import matplotlib.pyplot as plt
import pandas as pd
Step 2: Importing the dataset
dataset = pd.read_csv('./salary.csv')
X = dataset.iloc[:,:-1].values
Y = dataset.iloc[:,-1].values
Step 3: Splitting the dataset into the test set and training set
from sklearn.model_selection import train_test_split
X_train, X_test, Y_train, Y_test = train_test_split(X, Y, test_size = 1/3, random_state = 0)
Step 4 : Building and training the Simple Linear Regression Model
You have split the data set into the training set and the test set, we will be using the training set to train the model and the test set to evaluate the model.
You can implement the Simple Linear Regression model from the scratch, but we also have libraries that are ready to use to build the model. We can import Linear Regression from scikit-learn.linear_model . The SLR you are going to build is an instance of the LinearRegression class. The method used to train the regression model is the fit method.
from sklearn.linear_model import LinearRegression
slr =  LinearRegression()
slr.fit(X_train, Y_train)
Step 5 : Predicting the test set results with the model
Now you need to predict the results of the observation in the test set. Now after getting the predicted result from the SLR model, you have to compare the actual outcome and the predicted salary outcome. The vector containing the predicted results is stored in the y_pred variable. Now y_test contains the real salaries and y_pred contains the predicted salaries. In the next step we will be comparing the results.
y_pred = slr.predict(X_test)
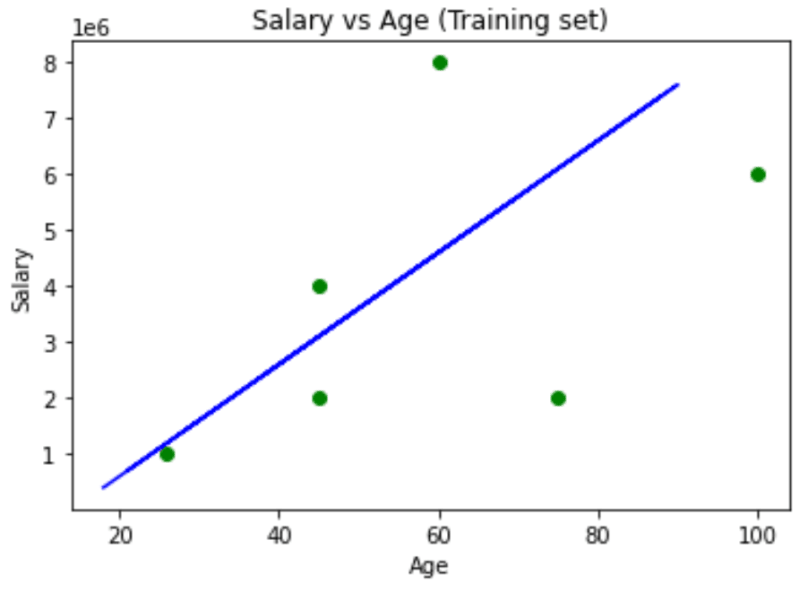
Step 6: Visualising the Training set results
We will be using matplotlib to plot some nice graphs. The scatter method plots one dot for each observation in the dataset. It will require two arrays of the same length, one for the values of the x-axis (age) and the other for the values in the y-axis (Salary).
After scattering the plots, we should draw the regression line, it is the line of the predictions coming as close as possible to the real results. Hence in SLR, the predicted outcome will follow a straight line. We will call the plot function in order to draw the line.
plt.scatter(X_train, Y_train, color = 'green')
plt.plot(X_train, slr.predict(X_train), color = 'blue')
plt.title('Salary vs Age (Training set)')
plt.xlabel('Age')
plt.ylabel('Salary')
plt.show()

Step 7: Visualising the Test set results
Now we are going to follow the above step again for the test data set. But just for plotting we will use the test set(real observations), but for drawing the regression line we will be using only the test set. Because the regression line we get is resulting from a unique equation , and hence the predicted salaries of the test set will be on the same regression line as the predicted salaries of the training set.
If we use the test set, it would give us a completely different equation, so it is not advisable.
plt.scatter(X_test, Y_test, color = 'green')
plt.plot(X_train, slr.predict(X_train), color = 'blue')
plt.title('Salary vs Age (Training set)')
plt.xlabel('Age')
plt.ylabel('Salary')
plt.show()
By the above observations, when someone asks for the salary of a person, the system would predict the value based on the blue regression line. The dataset i have used is of random values an is not accurate, please prepare or download enterprise grade datasets so that the predicted SLR line will be much more accurate.


Top comments (2)
This is so awesome, please write more on other Algorithms
Thank you @maen ... will update asap