And here we are, at the final part of this journey... When I started less than a month ago, I didn't think I would be able to write all these articles. Thanks to this hackathon, I had the opportunity to study and delve into many topics, from GitHub Actions to Grafana.
In this last part, we will talk about Grafana and how to use it to visualize the data we have collected so far on a dashboard.
Adding GitHub Credentials
First of all, I want to let you know that I made a small modification to the repository indexing preparation script to pass the GitHub token.
In particular, I added the call to this GraphQL mutation after creating the provider:
if(process.env.PAT_TOKEN) {
    await addCredential(idProvider, process.env.PAT_TOKEN);
}
And of course, the configuration within the workflow involves passing the parameter as an environment variable:
- name: Run script
  run: npm start
  env:
    CONFIG_PATH: ../../config.json
    ENDPOINT: http://localhost:5433/graphql
    PAT_TOKEN: ${{ secrets.GITHUB_TOKEN }}
Regarding the correct value to pass, I had some doubts as well. Initially, I followed the instructions on the MergeStatat website, which suggested passing a GitHub Personal Access Token (PAT), in my scenario associated with my user account as a secret in the workflow. However, I also tried using the GITHUB_TOKEN, and in the end, I found that it works correctly (at least for public repositories), although it has fewer privileges.
Furthermore, compared to the first article, I also modified how the first two parameters are passed, as shown in the code snippet before.
Configure Grafana with Docker-Compose
The goal is to set up a preconfigured instance of Grafana that is ready to use with Codespace. On the MergeStat GitHub repository, there is a docker-compose configuration that instantiates Grafana. Initially, I considered using it, but ultimately opted for a simpler solution without external volumes:
grafana:
    image: grafana/grafana-oss:latest
    environment:
      - GF_AUTH_ANONYMOUS_ORG_ROLE=Admin
      - GF_AUTH_ANONYMOUS_ENABLED=true
      - GF_AUTH_BASIC_ENABLED=false
    ports:
      - 3000:3000
    depends_on:
      - postgres
    restart: unless-stopped
    volumes:
      - ../grafana:/etc/grafana/provisioning/
In order to simplify the setup, I disabled authentication by directly utilizing environment variables, enabling anonymous access. Additionally, I mounted the ../grafana folder under /etc/grafana/provisioning/, allowing preloading of the datasource and dashboards.
Within the grafana folder, you will find two subfolders:
- datasources
- dashboards
Under datasources, there is a YAML file with the following configuration, allowing to configure a Postgres datasource and enabling connection to the local database:
apiVersion: 1

datasources:
  - uid: mypostgres
    name: MergestatDb
    type: postgres
    access: proxy
    url: postgres
    user: postgres
    database: mergestat
    withCredentials: false
    isDefault: true
    jsonData:
      sslmode: "disable"
    secureJsonData:
      password: postgres
This file allows you to configure a Postgres datasource, enabling connection to the local database.
For preloading the dashboards, the "dashboards.yaml" file will be used:
apiVersion: 1

providers:
  - name: 'MergeStat'
    type: file
    allowUiUpdates: true
    options:
      path: /etc/grafana/provisioning/dashboards
      foldersFromFilesStructure: true
Note that the foldersFromFilesStructure flag will create subfolders under Grafana, mirroring the current file system hierarchy.
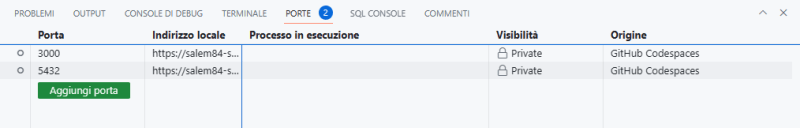
Once this is done and Codespace is launched, you can simply connect to the Grafana instance by accessing the address using the Ports functionality of Codespace.
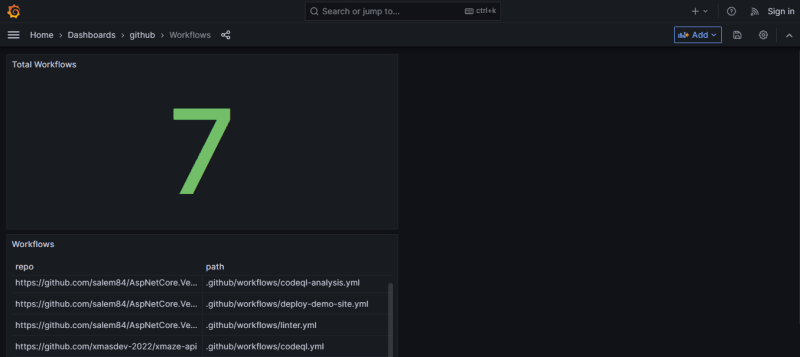
And the dashboards will be ready for immediate use:
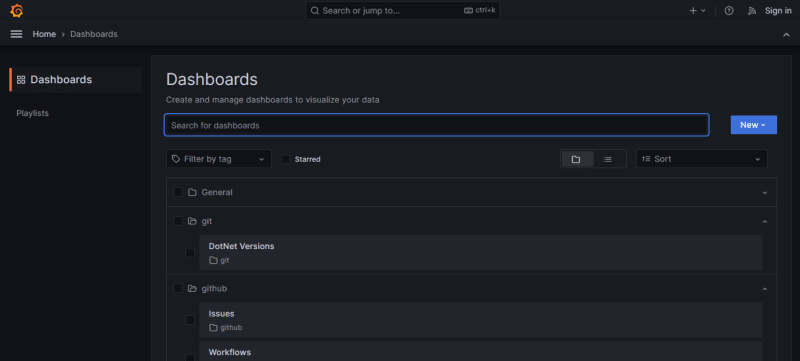
GitHub Workflows sample dashboard
Conclusions
Thank you for the link to the MergeStat website, where users can find various pre-made queries and dashboards covering commit statistics to the number of open pull requests.
We hope you enjoyed this article series! If you found it helpful or have any comments or suggestions, we would love to hear from you. Don't forget to leave a comment or give it a feedback ❤️ if you found the content valuable.
Stay tuned for more exciting content in the future!

Top comments (0)