
Originally published at deepu.tech.
In this multi-part series, I aim to demystify the concepts behind memory management and take a deeper look at memory management in some of the modern programming languages. I hope the series would give you some insights into what is happening under the hood of these languages in terms of memory management.
In this chapter, we will look at the memory management of the Go programming language(Golang). Go is a statically typed & compiled language like C/C++ and Rust. Hence Go does not need a VM and Go application binaries include a small runtime embedded in them to take care of language features like Garbage collection, scheduling & concurrency.
If you haven't read the first part of this series, please read it first as I explained the difference between the Stack and Heap memory there which would be useful to understand this chapter.
This post is based on Go 1.13 default official implementation and concept details might change in the future versions of Go
Go internal memory structure
First, let us see what the internal memory structure of Go is.
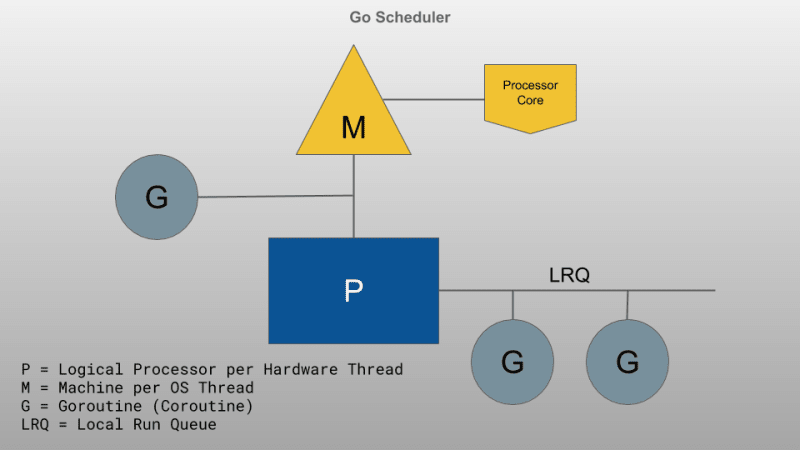
Go Runtime schedules Goroutines (
G) onto Logical Processors (P) for execution. EachPhas a machine (M). We will useP,M&Gthroughout this post. If you’re not familiar with the Go scheduler read Go scheduler: Ms, Ps & Gs first.
Each Go program process is allocated some virtual memory by the Operating System(OS), this is the total memory that the process has access to. The actual memory that is used within the virtual memory is called Resident Set. This space is managed by the internal memory constructs as below:
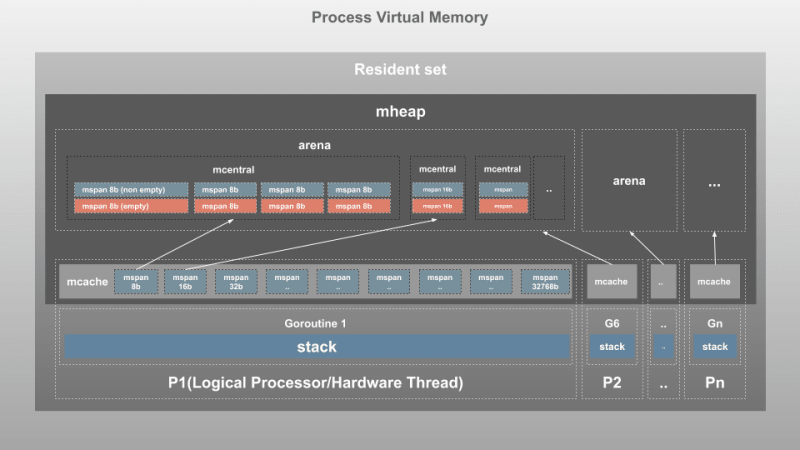
This is a simplified view based on the internal objects used by Go, In reality, Go divides and groups memory into pages as described in this great article.
This is quite different from the memory structure we saw in the previous chapters for JVM and V8. As you can see there is no generational memory here. The main reason for this is the TCMalloc(Thread-Caching Malloc), which is what Go's own memory allocator was modeled upon.
Let us see what the different constructs are:
Page Heap(mheap)
This is where Go stores dynamic data(any data for which size cannot be calculated at compile time). This is the biggest block of memory and this is where Garbage Collection(GC) takes place.
The resident set is divided into pages of 8KB each and is managed by one global mheap object.
Large objects(Object of Size > 32kb) are allocated directly from
mheap. These large requests come at an expense of central lock, so only oneP’s request can be served at any given point in time.
mheap manages pages grouped into different constructs as below:
-
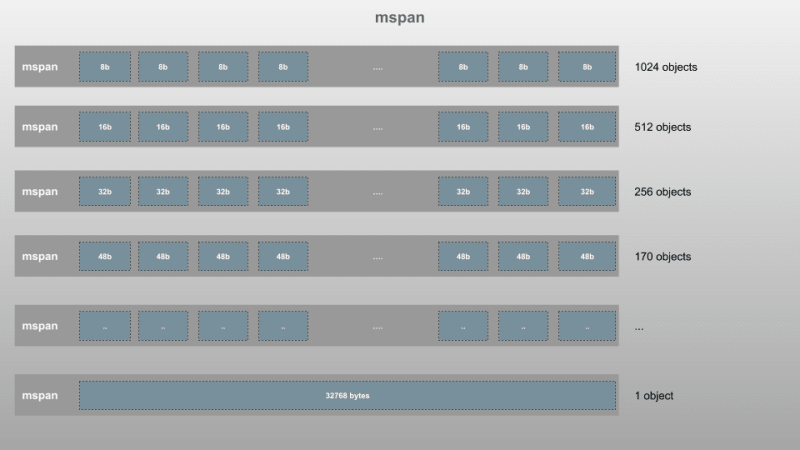
mspan:
mspanis the most basic structure that manages the pages of memory inmheap. It's a double-linked list that holds the address of the start page, span size class, and the number of pages in the span. Like TCMalloc, Go also divides Memory Pages into a block of 67 different classes by size starting at 8 bytes up to 32 kilobytes as in the below image
Each span exists twice, one for objects with pointers (scan classes) and one for objects with no pointers (noscan classes). This helps during GC as noscan spans need not be traversed to look for live objects.
-
mcentral:
mcentralgroups spans of same size class together. Eachmcentralcontains twomspanList:-
empty: Double linked list of spans with no free objects or spans that are cached in a
mcache. When a span here is freed, it's moved to the nonempty list. -
non-empty: Double linked list of spans with a free object. When a new span is requested from
mcentral, it takes that from the nonempty list and moves it into the empty list.
-
empty: Double linked list of spans with no free objects or spans that are cached in a
When mcentral doesn't have any free span, it requests a new run of pages from mheap.
arena: The heap memory grows and shrinks as required within the virtual memory allocated. When more memory is needed,
mheappulls them from the virtual memory as a chunk of 64MB(for 64-bit architectures) calledarena. The pages are mapped to spans here.mcache: This is a very interesting construct.
mcacheis a cache of memory provided to aP(Logical Processor) to store small objects(Object size <=32Kb). Though this resembles the thread stack, it is part of the heap and is used for dynamic data.mcachecontainsscanandnoscantypes ofmspanfor all class sizes. Goroutines can obtain memory frommcachewithout any locks as aPcan have only oneGat a time. Hence this is more efficient.mcacherequests new spans frommcentralwhen required.
Stack
This is the stack memory area and there is one stack per Goroutine(G). This is where static data including function frames, static structs, primitive values, and pointers to dynamic structs are stored. This is not the same as mcache which is assigned to a P
Go memory usage (Stack vs Heap)
Now that we are clear about how memory is organized let's see how Go uses Stack and Heap when a program is executed.
Let's use the below Go program, the code is not optimized for correctness hence ignore issues like unnecessary intermediatory variables and such, the focus is to visualize stack and heap memory usage.
package main

import "fmt"

type Employee struct {
  name   string
  salary int
  sales  int
  bonus  int
}

const BONUS_PERCENTAGE = 10

func getBonusPercentage(salary int) int {
  percentage := (salary * BONUS_PERCENTAGE) / 100
  return percentage
}

func findEmployeeBonus(salary, noOfSales int) int {
  bonusPercentage := getBonusPercentage(salary)
  bonus := bonusPercentage * noOfSales
  return bonus
}

func main() {
  var john = Employee{"John", 5000, 5, 0}
  john.bonus = findEmployeeBonus(john.salary, john.sales)
  fmt.Println(john.bonus)
}
One major difference Go has compared to many garbage collected languages is that many objects are allocated directly on the program stack. The Go compiler uses a process called escape analysis to find objects whose lifetime is known at compile-time and allocates them on the stack rather than in garbage-collected heap memory.
During compilation, Go does the escape analysis to determine what can go into Stack(static data) and what needs to go into Heap(dynamic data). We can see these details during compilation by running go build with -gcflags '-m' flag. For the above code, it will output something like the below:
❯ go build -gcflags '-m' gc.go
# command-line-arguments
temp/gc.go:14:6: can inline getBonusPercentage
temp/gc.go:19:6: can inline findEmployeeBonus
temp/gc.go:20:39: inlining call to getBonusPercentage
temp/gc.go:27:32: inlining call to findEmployeeBonus
temp/gc.go:27:32: inlining call to getBonusPercentage
temp/gc.go:28:13: inlining call to fmt.Println
temp/gc.go:28:18: john.bonus escapes to heap
temp/gc.go:28:13: io.Writer(os.Stdout) escapes to heap
temp/gc.go:28:13: main []interface {} literal does not escape
<autogenerated>:1: os.(*File).close .this does not escape
Let us visualize this. Click on the slides and move forward/backward using arrow keys to see how the above program is executed and how the stack and heap memory is used:
Note: If the slides look cut off at edges, then click on the title of the slide or here to open it directly in SpeakerDeck.
As you can see:
- Main function is kept in a "main frame" on the Stack
- Every function call is added to the stack memory as a frame-block
- All static variables including arguments and the return value is saved within the function frame-block on the Stack
- All static values regardless of type are stored directly on the Stack. This applies to global scope as well
- All dynamic types are created on the Heap and is referenced from the Stack using Stack pointers. Objects of size less than 32Kb go to the
mcacheof theP. This applies to global scope as well - The struct with static data is kept on the stack until any dynamic value is added at that point the struct is moved to the heap
- Functions called from the current function is pushed on top of the Stack
- When a function returns its frame is removed from the Stack
- Once the main process is complete, the objects on the Heap do not have any more pointers from Stack and becomes orphan
The Stack as you can see is automatically managed and is done so by the operating system rather than Go itself. Hence we do not have to worry much about the Stack. The Heap, on the other hand, is not automatically managed by the OS and since it's the biggest memory space and holds dynamic data, it could grow exponentially causing our program to run out of memory over time. It also becomes fragmented over time slowing down applications. This is where garbage collection comes in.
Go Memory management
Go's memory management involves automatic allocation when memory is needed and garbage collection when memory is not needed anymore. It's done by the standard library. Unlike C/C++ the developer does not have to deal with it and the underlying management done by Go is well optimized and efficient.
Memory Allocation
Many programming languages that employ Garbage collection use a generational memory structure to make collection efficient along with compaction to reduce fragmentation. Go takes a different approach here, as we saw earlier, Go structures memory quite differently. Go employs a thread-local cache to speed up small object allocations and maintains scan/noscan spans to speed up GC. This structure along with the process avoids fragmentation to a great extent making compact unnecessary during GC. Let's see how this allocation takes place.
Go decides the allocation process of an object based on its size and is divided into three categories:
Tiny(size < 16B): Objects of size less than 16 bytes are allocated using the mcache's tiny allocator. This is efficient and multiple tiny allocations are done on a single 16-byte block.
Small(size 16B ~ 32KB): Objects of size between 16 bytes and 32 Kilobytes are allocated on the corresponding size class(mspan) on mcache of the P where the G is running.
In both tiny and small allocation if the mspan’s list is empty the allocator will obtain a run of pages from the mheap to use for the mspan. If the mheap is empty or has no page runs large enough then it allocates a new group of pages (at least 1MB) from the OS.
Large(size > 32KB): Objects of size greater than 32 kilobytes are allocated directly on the corresponding size class of mheap. If the mheap is empty or has no page runs large enough then it allocates a new group of pages (at least 1MB) from the OS.
Note: You can find the above GIF images as slideshow here
Garbage collection
Now that we know how Go allocates memory, let us see how it automatically collects the Heap memory which is very important for the performance of an application. When a program tries to allocate more memory on the Heap than that is freely available we encounter out of memory errors. An incorrectly managed heap could also cause a memory leak.
Go manages the heap memory by garbage collection. In simple terms, it frees the memory used by orphan objects, i.e, objects that are no longer referenced from the Stack directly or indirectly(via a reference in another object) to make space for new object creation.
As of version 1.12, the Golang uses a non-generational concurrent tri-color mark and sweep collector. The collection process roughly looks like the below, I don't want to go into details as it changes from version to version. However, if you are interested in those, then I recommend this great series.
The process starts when a certain percentage(GC Percentage) of heap allocations are done and the collector does different phases of work:
- Mark Setup (Stop the world): When GC starts, the collector turns on write barriers so that data integrity can be maintained during the next concurrent phase. This step needs a very small pause as every running Goroutine is paused to enable this and then continues.
-
Marking (Concurrent): Once write barriers are turned on the actual marking process is started in parallel to the application using 25% of the available CPU capacity. The corresponding
Ps are reserved until marking is complete. This is done using dedicated Goroutines. Here the GC marks values in the heap that is alive(referenced from the Stack of any active Goroutines). When collection takes longer the process may employ active Goroutine from application to assist in the marking process. this is called Mark Assist. -
Mark Termination (Stop the world): Once marking is done every active Goroutine is paused and write barriers are turned off and clean up tasks are started. The GC also calculates the next GC goal here. Once this is done the reserved
Ps are released back to the application. - Sweeping (Concurrent): Once the collection is done and allocations are attempted, the sweeping process starts to reclaim memory from the heap that is not marked alive. The amount of memory swept is synchronous to the amount being allocated.
Let us see these in action for a single Goroutine. The number of objects is kept small for brevity. Click on the slides and move forward/backward using arrow keys to see the process:
Note: If the slides look cut off at edges, then click on the title of the slide or here to open it directly in SpeakerDeck.
- We are looking at a single Goroutine, the actual process does this for all active Goroutines. The write barriers are turned on first.
- The marking process picks a GC root and colors it black and traverses pointers from it in a depth-first tree-like manner, it marks each object encountered grey
- When it reaches an object in a
noscanspan or when an object has no more pointers it finishes for the root and picks up the next GC root object - Once all GC roots are scanned, it picks up a grey object and continues to traverse its pointers in a similar fashion
- If there are any pointer changes to an object when write barriers are on, the object gets colored grey so that GC re-scans it
- When there are no more grey objects left, the marking process is complete and the write barrier is turned off
- Sweeping will take place when allocations start
This has some stop-the-world process but it's generally very fast that it is negligible most of the time. The coloring of objects takes place in the gcmarkBits attribute on the span.
Conclusion
This post should give you an overview of the Go memory structure and memory management. This is not exhaustive, there are a lot more advanced concepts and the implementation details keep changing from version to version. But for most Go developers this level of information would be sufficient and I hope it helps you write better code, considering these in mind, for more performant applications, and keeping these in mind would help you to avoid the next memory leak issue you might encounter otherwise.
I hope you had fun learning this, stay tuned for the next post in the series.
References
- blog.learngoprogramming.com
- www.ardanlabs.com
- povilasv.me
- medium.com/a-journey-with-go
- medium.com/a-journey-with-go
- hub.packtpub.com
- making.pusher.com
- segment.com/blog
- go101.org
If you like this article, please leave a like or a comment.
You can follow me on Twitter and LinkedIn.
Cover image inspired by a-journey-with-go

Top comments (2)
deepu, the pictures in the blog are very beatiful! Which tool do you use to draw these?
Google slides :)