Wild missingno appeared!
Missingno is the patron Pokemon of data science. You’re just casually
surfing up and down your data, doing some sweet coding, when suddenly a
bunch of missing and corrupted data gets in you way, and you suddenly
have a bunch of random items in your bag for no reason. OK, well maybe I
just have a messy bag.
The valuable part of this metaphor is the part where you battle
Missingno, and win. I’ve been doing this with my Pokedex project
recently, to try and iron out what data I can rely on from my data
source, and what’s a bit patchy.
library(pokedex)
library(tidyverse)
library(naniar)
library(skimr)
Go, Skimr!
Skimr gives us a text based summary view. As well as the basics on data
set size, it also shows us some statistical values, but most valuably it
describes how many values are missing, and in what columns.
pokemon %>%
  skimr::skim()
| Name | Piped data |
| Number of rows | 807 |
| Number of columns | 24 |
| _______________________ | |
| Column type frequency: | |
| character | 8 |
| list | 1 |
| numeric | 15 |
| ________________________ | |
| Group variables | None |
Data summary
Variable type: character
| skim_variable | n_missing | complete_rate | min | max | empty | n_unique | whitespace |
|---|---|---|---|---|---|---|---|
| identifier | 0 | 1.00 | 3 | 20 | 0 | 807 | 0 |
| type_1 | 0 | 1.00 | 3 | 8 | 0 | 18 | 0 |
| type_2 | 402 | 0.50 | 3 | 8 | 0 | 18 | 0 |
| name | 0 | 1.00 | 3 | 12 | 0 | 807 | 0 |
| genus | 0 | 1.00 | 11 | 21 | 0 | 589 | 0 |
| color | 20 | 0.98 | 3 | 6 | 0 | 10 | 0 |
| shape | 20 | 0.98 | 4 | 9 | 0 | 14 | 0 |
| habitat | 422 | 0.48 | 3 | 13 | 0 | 9 | 0 |
Variable type: list
| skim_variable | n_missing | complete_rate | n_unique | min_length | max_length |
|---|---|---|---|---|---|
| flavour_text | 0 | 1 | 807 | 1 | 1 |
Variable type: numeric
| skim_variable | n_missing | complete_rate | mean | sd | p0 | p25 | p50 | p75 | p100 | hist |
|---|---|---|---|---|---|---|---|---|---|---|
| id | 0 | 1.00 | 404.00 | 233.11 | 1.0 | 202.5 | 404 | 605.5 | 807.0 | ▇▇▇▇▇ |
| species_id | 0 | 1.00 | 404.00 | 233.11 | 1.0 | 202.5 | 404 | 605.5 | 807.0 | ▇▇▇▇▇ |
| height | 0 | 1.00 | 1.16 | 1.08 | 0.1 | 0.6 | 1 | 1.5 | 14.5 | ▇▁▁▁▁ |
| weight | 0 | 1.00 | 61.77 | 111.52 | 0.1 | 9.0 | 27 | 63.0 | 999.9 | ▇▁▁▁▁ |
| base_experience | 0 | 1.00 | 144.85 | 74.95 | 36.0 | 66.0 | 151 | 179.5 | 608.0 | ▇▇▁▁▁ |
| is_default | 0 | 1.00 | 1.00 | 0.00 | 1.0 | 1.0 | 1 | 1.0 | 1.0 | ▁▁▇▁▁ |
| hp | 0 | 1.00 | 68.75 | 26.03 | 1.0 | 50.0 | 65 | 80.0 | 255.0 | ▃▇▁▁▁ |
| attack | 0 | 1.00 | 76.09 | 29.54 | 5.0 | 55.0 | 75 | 95.0 | 181.0 | ▂▇▆▂▁ |
| defense | 0 | 1.00 | 71.73 | 29.73 | 5.0 | 50.0 | 67 | 89.0 | 230.0 | ▅▇▂▁▁ |
| special_attack | 0 | 1.00 | 69.49 | 29.44 | 10.0 | 45.0 | 65 | 90.0 | 173.0 | ▃▇▅▂▁ |
| special_defense | 0 | 1.00 | 70.01 | 27.29 | 20.0 | 50.0 | 65 | 85.0 | 230.0 | ▇▇▂▁▁ |
| speed | 0 | 1.00 | 65.83 | 27.74 | 5.0 | 45.0 | 65 | 85.0 | 160.0 | ▃▇▆▂▁ |
| generation_id | 20 | 0.98 | 3.67 | 1.94 | 1.0 | 2.0 | 4 | 5.0 | 7.0 | ▇▅▃▅▅ |
| evolves_from_species_id | 426 | 0.47 | 364.35 | 232.43 | 1.0 | 156.0 | 345 | 570.0 | 803.0 | ▇▆▅▆▅ |
| evolution_chain_id | 20 | 0.98 | 195.96 | 124.57 | 1.0 | 84.0 | 187 | 303.0 | 427.0 | ▇▆▅▆▅ |
I was expecting some missing data in type_2, and
evolves_from_species_id, but I wasn’t expecting only half of habitat
to be there. Either I broke something in my data pipeline, or the data
wasn’t there to begin with. colour, shape, generation_id and
evolution_chain_id are all missing 20 entries each, which is a bit or
a coincidence. I wonder if they are all missing from the same Pokemon?
Visdat I choose you!
visdat is a package that helps you visualise missing data and data
types.
visdat::vis_dat(pokemon)

This clearly shows us the data types in each column, and where values
are missing in context. It looks like habitat might just not be
available after a certain time. It also looks like colour, shape,
generation_id and evolution_chain_id looks like they are maybe all
missing from the same individual Pokemon?
Go, Naniar!
Naniar helps us check through plots where relationships between
missing values and other variables might occur. Lets check first if
there is a relationship between generation_id and evolution_chain_id
pokemon %>%
  ggplot(aes(generation_id, evolution_chain_id)) +
  geom_miss_point()
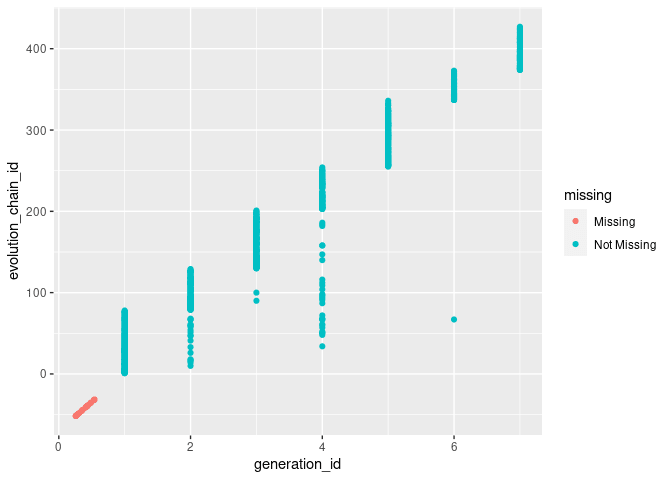
This plot might need a little explanation. For the Not Missing blue
values, this is a normal geom_point(). However, where the values are
marked as Missing pink they are deliberately moved below the (0,0)
mark for the axis they are missing values for, then they ‘jitter’, to
avoid over-plotting. The little cluster at the far bottom left in a line
marks that for all values where evolution_chain_id being missing,
generation_id is also missing. Let’s have a look at the
evolves_from_species_id variable just to help us understand.
pokemon %>%
  ggplot(aes(evolves_from_species_id, generation_id)) +
  geom_miss_point()
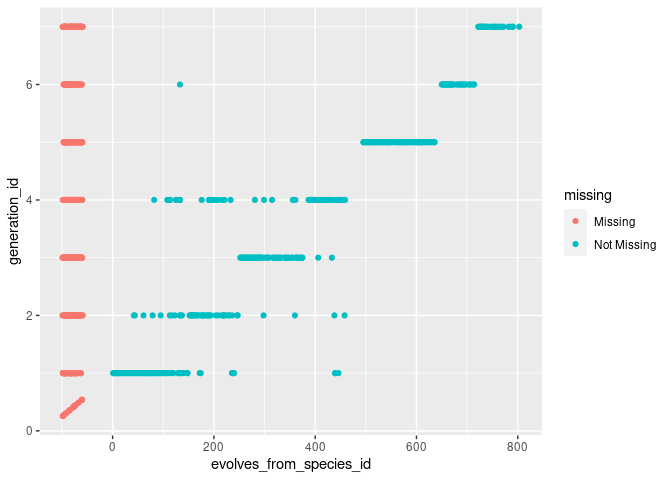
This is showing that in every game generation (Red/Blue, X/Y, etc.) that
there are Pokemon that have an evolves_from_species_id, i.e. they have
a precursor Pokemon, and that there are also Pokemon that don’t have a
precursor. Just what we see in the games. It’s also showing that have
neither generation_id or evolves_from_species_id.
Who is that Pokemon?
Now we know the characteristics of the missing data we are interested
in, we can pull them out easily. Especially with the newly released
across() function
missing_cols <- c("color", "shape", "generation_id", "evolves_from_species_id")
pokemon %>%
  filter(across(missing_cols, ~is.na(.x))) %>%
  select(name, identifier, missing_cols) -> missing_pokes

missing_pokes %>% knitr::kable()
| name | identifier | color | shape | generation_id | evolves_from_species_id |
|---|---|---|---|---|---|
| Deoxys | deoxys-normal | NA | NA | NA | NA |
| Wormadam | wormadam-plant | NA | NA | NA | NA |
| Giratina | giratina-altered | NA | NA | NA | NA |
| Shaymin | shaymin-land | NA | NA | NA | NA |
| Basculin | basculin-red-striped | NA | NA | NA | NA |
| Darmanitan | darmanitan-standard | NA | NA | NA | NA |
| Tornadus | tornadus-incarnate | NA | NA | NA | NA |
| Thundurus | thundurus-incarnate | NA | NA | NA | NA |
| Landorus | landorus-incarnate | NA | NA | NA | NA |
| Keldeo | keldeo-ordinary | NA | NA | NA | NA |
| Meloetta | meloetta-aria | NA | NA | NA | NA |
| Meowstic | meowstic-male | NA | NA | NA | NA |
| Aegislash | aegislash-shield | NA | NA | NA | NA |
| Pumpkaboo | pumpkaboo-average | NA | NA | NA | NA |
| Gourgeist | gourgeist-average | NA | NA | NA | NA |
| Oricorio | oricorio-baile | NA | NA | NA | NA |
| Lycanroc | lycanroc-midday | NA | NA | NA | NA |
| Wishiwashi | wishiwashi-solo | NA | NA | NA | NA |
| Minior | minior-red-meteor | NA | NA | NA | NA |
| Mimikyu | mimikyu-disguised | NA | NA | NA | NA |
So it looks like in the current version of the package, these Pokemon
all have ‘complex’ identifiers. This is because these Pokemon all have
different forms. Some vary by colour like
Basculin
which can be Red or Blue striped, others have ability transformations,
like
Aegislash
or which game it was caught in like
Deoxys.
missing_pokes %>%
  pull(name) %>%
  stringr::str_to_lower(.) -> missing_pokes_name_list

pokedex$pokemon_species %>%
  filter(
    stringr::str_to_lower(identifier) %in% missing_pokes_name_list
    ) %>%
  select(identifier, generation_id, evolves_from_species_id, shape_id, color_id) %>%
  knitr::kable()
| identifier | generation_id | evolves_from_species_id | shape_id | color_id |
|---|---|---|---|---|
| deoxys | 3 | NA | 12 | 8 |
| wormadam | 4 | 412 | 5 | 5 |
| giratina | 4 | NA | 10 | 1 |
| shaymin | 4 | NA | 8 | 5 |
| basculin | 5 | NA | 3 | 5 |
| darmanitan | 5 | 554 | 8 | 8 |
| tornadus | 5 | NA | 4 | 5 |
| thundurus | 5 | NA | 4 | 2 |
| landorus | 5 | NA | 4 | 3 |
| keldeo | 5 | NA | 8 | 10 |
| meloetta | 5 | NA | 12 | 9 |
| meowstic | 6 | 677 | 6 | 2 |
| aegislash | 6 | 680 | 5 | 3 |
| pumpkaboo | 6 | NA | 1 | 3 |
| gourgeist | 6 | 710 | 5 | 3 |
| oricorio | 7 | NA | 9 | 8 |
| lycanroc | 7 | 744 | 8 | 3 |
| wishiwashi | 7 | NA | 3 | 2 |
| minior | 7 | NA | 1 | 3 |
| mimikyu | 7 | NA | 2 | 10 |
If we go back to the raw source data, we can see that the data is
actually there for most cases, it just didn’t join properly because in
the source data, they are identified by the simple name, in lower case,
and in this version of the
package
this data is joined on id AND the column that actually has the complex
name. Also, because shape and color link through this data, they are
missed as well!
You defeated wild missingno!
This is all based on my Pokedex R data package, which I’m just about to
fix :)

Top comments (0)