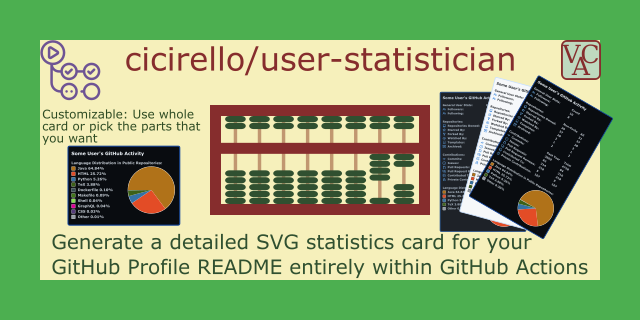
I recently released a GitHub Action, user-statistician, that generates a detailed GitHub stats SVG entirely within GitHub Actions. It generates a detailed visual summary of your activity on GitHub, suitable to display on your GitHub Profile README. Check out the GitHub repository for details:
 cicirello
/
user-statistician
Generate a GitHub stats SVG for your GitHub Profile README in GitHub Actions
user-statistician
Check out all of our GitHub Actions: https://actions.cicirello.org/
The cicirello/user-statistician GitHub Action generates a detailed visual summary of your activity on GitHub in the form of an SVG suitable to display on your GitHub Profile README Although the intended use-case is to generate an SVG image for your GitHub Profile README, you can also potentially link to the image from a personal website, or from anywhere else where you'd like to share a summary of your activity on GitHub. The SVG that the action generates includes statistics for the repositories that you own, your contribution statistics (e.g., commits, issues, PRs, etc), as well as the distribution of languages within public repositories that you own. The user stats image can be customized, including the colors such as with one of the built-in themes or your own set of custom…
Although the intended use-case is to generate an SVG image for your GitHub Profile README, you can also potentially link to the image from a personal website, or from anywhere else where you'd like to share a summary of your activity on GitHub. As an example, here is the version I have on my personal website, using the custom colors feature to match the color palette of my site:
Check out my GitHub Profile for an additional live example, which uses the built-in dark theme.
The SVG that the action generates includes statistics for the repositories that you own, your contribution statistics (e.g., commits, issues, PRs, etc), as well as a pie chart of the distribution of languages within public repositories that you own, which can optionally be animated. The stats image can be customized in a variety of ways, including the colors such as with one of the built-in themes or your own set of custom colors. You can also pick and choose which sections to include, as well as the order of appearance of the sections; and you can choose to hide individual stats. If you prefer to have separate SVGs for the different categories of stats, you can use the action to do that too.
Setting up the action is easy. The GitHub repository has a quickstart directory containing several ready-to-use workflows to get you started. Pick one, download it, commit it to the .github/workflows directory of your profile's repository, and add a link to the generated image in your README. The quickstart workflows are configured to run nightly on a schedule, on pushes of the workflow file, as well as on workflow_dispatch events (so you can run it manually if need be).
How to Try Out the Action
If you want to try the action out, just drop the following workflow into a file with the name "user-statistician.yml" in the ".github/workflows" directory of your profile repository (or technically any repository that you own). It uses all of the action's default settings, and which runs the action daily on a schedule, and every time the workflow itself is changed (assumes the workflow file name is "user-statistician.yml").
name: user-statistician

on:
  schedule:
    - cron: '0 3 * * *'
  push:
    branches: [ main ]
    paths: [ '.github/workflows/user-statistician.yml' ]
  workflow_dispatch:

jobs:
  stats:
    runs-on: ubuntu-latest

    steps:
    - uses: actions/checkout@v2

    - name: Generate the user stats image
      uses: cicirello/user-statistician@v1
      env:
        GITHUB_TOKEN: ${{secrets.GITHUB_TOKEN}}
You can then link to the image it generates from your README with the following markdown:


Top comments (0)