Debugging is the process of finding or fixing errors (bugs) within a script.
Browsers contain debugging tools for developers to debug or trace code step by step.
Before following the steps below, hit Ctrl + Shift + N to open an incognito window on chrome browser.
Below are the steps to debug or understand codes in a script:
1.) To open a console terminal, enter F12 or Ctrl + Shift + J.
2.) Open the sources navbar and do the following:
- Click the
Sourcesnavigator tab. - Click the
+ New snippetbutton and rename the filemyScript.js.
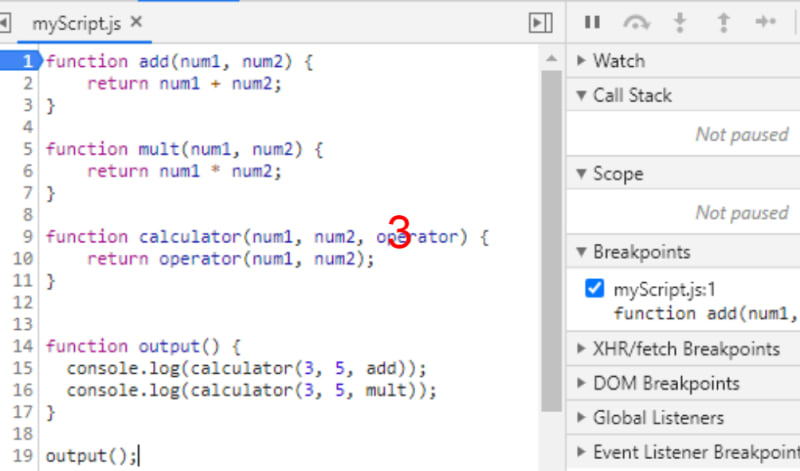
3.) Edit the file with the code below:
function add(num1, num2) {
    return num1 + num2;
}

function mult(num1, num2) {
    return num1 * num2;
}

function calculator(num1, num2, operator) {
    return operator(num1, num2);
}

function output() {
    console.log(calculator(3, 5, add));
    console.log(calculator(3, 5, mult));
}

output();
- Click on line 1 or line 2, not the code to specify where the breakpoint should start or resume debugging. You can have as many breakpoints in a script.
A breakpoint is a point of code where the debugger will automatically pause the JavaScript execution to examine current variables, scope, execute commands in the console, etc.
- Click the
Breakpointpanel to the right and examine the list of breakpoints. In the example, only one breakpoint was applied. Maybe apply another breakpoint to line 5.
4.) If the console is not open, enter ESC and navigate to the Console nav tab.

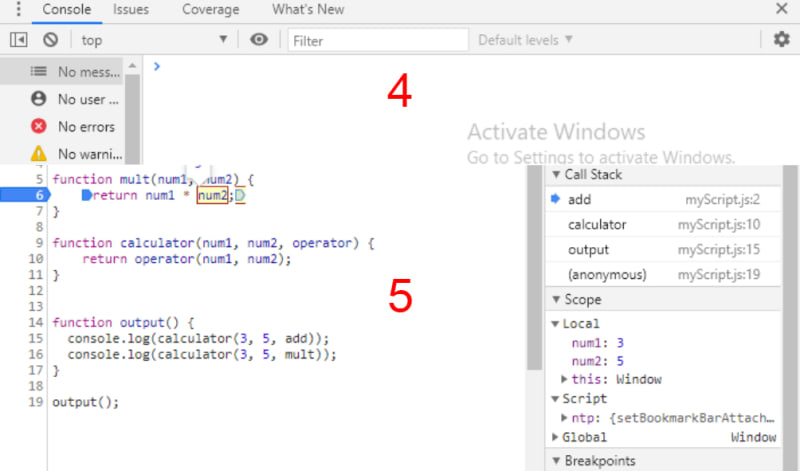
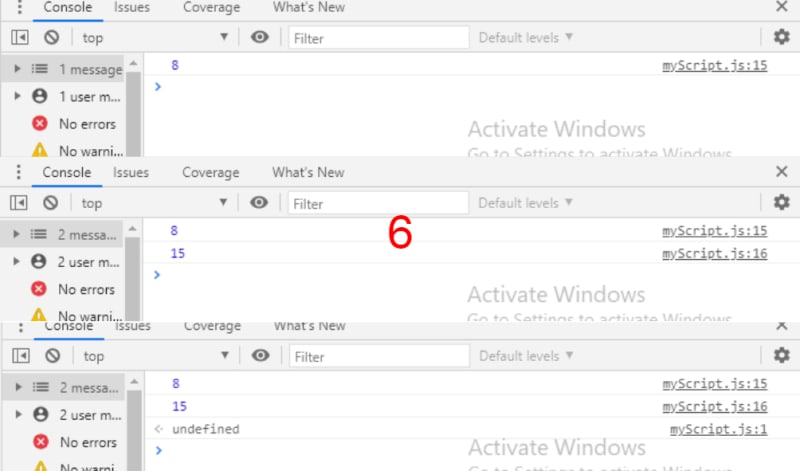
5.) Click the Run button at the bottom right or hit Ctrl + Enter to run the script. Also, enter F10 till you are satisfied. If you want to stop the debugger mode at any time, enter function F8.
6.) Keep entering F10 till the debugger stops or returns undefined in the console.

Debugger Statement
An alternative approach is to use the debugger command start instead of clicking line numbers.
In the example, only one debugger statement was applied. Maybe apply another debugger statement to line 6.
In the example below, the debugger starts at line 2. Here breakpoints are not applied.
function add(num1, num2) {
    debugger;
    return num1 + num2;
}

function mult(num1, num2) {
    // debugger;
    return num1 * num2;
}

function calculator(num1, num2, operator) {
    return operator(num1, num2);
}

function output() {
    console.log(calculator(3, 5, add));
    console.log(calculator(3, 5, mult));
}

output();
Hint: If you quickly want to show current values for any expressions during debugging, click the watch panel to open it and click the + sign to edit with relevant code.
calculator(4, 6, mult)
Happy coding!
TechStack Media | Western Union
- Receive a $20 Amazon.com e-gift code for free when you register
- Connect your bank account to western Union to receive or send money anywhere in the world.


Top comments (0)