
Welcome to part one of this two-part series on debugging in Elixir and Erlang. In this post, we'll use several different tools and techniques to debug Elixir code.
First, we'll get to know the demo project I created to showcase certain tools: dist_messenger. It's an Elixir project of a distributed messaging system that can be used directly on IEx. It allows users in different nodes to send and receive messages to each other.
Then, we'll learn about the basic debugging tools of Elixir: inspect, pry and dbg.
In part two, we'll turn our attention to Erlang, putting together what we learn into a simple script to trace a process message across nodes.
Let's get going!
The Necessity of Debugging
You write a piece of code, you run it, and it doesn't execute as expected.
That is what programming looks like most of the time. Trying to figure out what's happening can not only be time-consuming, but very frustrating when we don't have the right tools.
Can you level your washing machine without a leveling tool, instead using a ruler? Of course, but it will take much more time and energy.
So, to understand what's happening in our code, it's good sometimes to take a few steps back and ask some questions, like:
- Is the value of this variable correct?
- Are the transformations being applied to a variable producing the expected result?
- Are the messages being correctly sent from one process to another?
- Is there any abnormality in resource consumption?
Both Elixir and Erlang provide tools to answer these questions. Knowing how to use the tools certainly adds a lot of value.
Getting to Know Our Demo Project
The dist_messenger project uses a combination of GenServer and :global to provide a distributed messaging system inside an Erlang cluster.
Each node in this cluster can handle one user, and its state is maintained by a single GenServer, the Messenger.MessagingServer. Users can sign in to the cluster with a unique name, which is then registered across all nodes using the :global.register_name/2 function.
For the user interface, the Messenger.IExClient provides several functions that allow users to interact with the messaging system in IEx. This module is imported by the .iex.exsscript, so we can use all its functions directly on iex when running it with iex -S mix. Check the docs for .iex.exs
files.
Because each node handles one user, to get the full experience of this project, we need to run multiple nodes (by running nodes with a node name and a shared secret cookie). To make things simple, the project includes a script start that will do that for us. You just need to give the name (it will run all nodes on 0.0.0.0).
You'll notice that the included .iex.exs script will automatically try to connect to nodes node0 up to node9 on localhost. So, by naming the nodes within this range, we should get a cluster.
Let's start two nodes and sign-in two users: user alice on node0 and bob on node1.
# On terminal 1
$ ./start node0

# On terminal 2
$ ./start node0
To sign in to the messaging system, you can call sign in <name> on iex:
# node0 - user: alice
iex> sign in "alice"
Signed in!
Now you can send a message to other users using msg <user> <message>:
# node0 - user: alice
iex> msg "bob", "Hello! How are you?"
Message sent!
In bob's session, we get a notification that a new message has arrived:
# node1 - user: bob
[!] New message from alice
We can use the inbox command to view all received messages:
# node1 - user: bob
iex> inbox
> from: alice
> Hello! How are you?
---
In alice's session, we can use sent to view all sent messages:
# node0 - user: alice
iex> sent
> to: bob
> Hello! How are you?
---
There are also other commands:
-
signout: signs out the current users from the cluster -
whoami: prints the current signed-in user -
last_msg: prints the last received message -
editor: sends a message likemsg, but it's interactive
Now that we know how our example works, let's get started with debugging!
Elixir Debugging Basics
You can use the tools in this section to:
- quickly gather information about a specific variable
- get the result of a function call
- check a whole pipe chain
They do require changes in the source code, so we'll use them during development and tests.
Debugging with IO.inspect/2 in Elixir
This is the easiest — and probably the first — tool that an Elixir developer will reach for to investigate issues. The IO.inspect/2 function prints the contents of an expression and returns the expression itself.
iex> name = {:name, "Jack Shephard"}
iex> IO.inspect(name, label: "Name")
# Name: {:name, "Jack Shephard"}
It returns the value of the evaluated expression so that you can use it within a pipeline. The label option is very useful when you have multiple calls to IO.inspect and need some hints to understand what you are looking at.
person = %{name: "Kate Austen"}

iex> " some text "
...> |> String.trim()
...> |> String.upcase() |> IO.inspect(label: "Here")
...> |> String.split()
Here: "SOME TEXT"
["SOME", "TEXT"]
IEx.pry for Elixir
While IO.inspect allows you to read the content of any variable, IEx.pry gives us a bit more insight and information on the code.
You can think of IO.pry as an interactive IO.inspect.
Let's use it in the editor/0 function and see what happens:
...

def editor do
  case Messaging.whoami() do
    {:ok, _user} ->
      recipient = IO.gets("recipient: ") |> String.trim()
      message = IO.gets("message: ") |> String.trim()

      # Pause the execution here
      require IEx; IEx.pry

      msg(recipient, message)

    _ ->
      IO.puts("Not signed in!")
  end
end

...
Note: you must use IEx in the application context in order to use IEx.pry. This means you need to start it with iex -S mix.
When you call the editor/0 (after you type in the recipient and the message), the iex session will pause execution on the line.
iex> editor
recipient: kate.austen
message: Hello, Kate!
Break reached: Messenger.IExClient.editor/0 (lib/messenger/iex_client.ex:96)

   93:         recipient = IO.gets("recipient: ") |> String.trim()
   94:         message = IO.gets("message: ") |> String.trim()
   95:
   96:         require IEx; IEx.pry
   97:
   98:         msg(recipient, message)
   99:

pry>
In this new console, you can type a variable's name to see its contents:
pry> recipient
"kate.austen"
pry> message
"Hello, Kate!"
Type continue or next to continue the execution.
dbg/2 Debugging in Elixir
This is a new feature since Elixir 1.14. It's pretty much IO.inspect/2 with superpowers.
To demonstrate it, we'll add dbg to this demo line. It will be called whenever the server receives a message from another server.
# ...

def handle_info({:msg, from, body}, %{inbox: inbox} = state) do
  # ...

  message = {from, body}
  updated_state = %{state | inbox: [message | inbox]} |> dbg()

  {:noreply, updated_state}
end

#...
Now, when your node receives a message, the recipient's iex session will request to pry on the code:
[!] New message from jacob
Request to pry #PID<0.159.0> at Messenger.MessagingServer.handle_info/2 (lib/messenger/messaging_server.ex:82)

   79:     end
   80:
   81:     message = {from, body}
   82:     updated_state = %{state | inbox: [message | inbox]} |> dbg()
   83:
   84:     {:noreply, updated_state}
   85:   end

Allow? [Yn]
This will open an IEx.pry session, and you can check the values of all variables.
You can also use dbg at the end of a pipe to see what's happening:
[["h"], ["i"]] #=> [["h"], ["i"]
|> List.flatten() #=> ["h", "i"]
|> Enum.join() #=> "hi
|> dbg()
dbg/2 is macro-evaluated at compile time. When called, it will inject code
that allows the interpreter to pause an application's execution and pry the
current context. Check out 'Elixir 1.14: Better Debugging with dbg/2 and More' for an overview of dbg/2.
Debugging Production Apps with AppSignal
After deploying your app to production, AppSignal can help debug issues from the real world.
Set up AppSignal for your Elixir application, and you'll automatically gain access to an error dashboard with information about all the errors in your app.
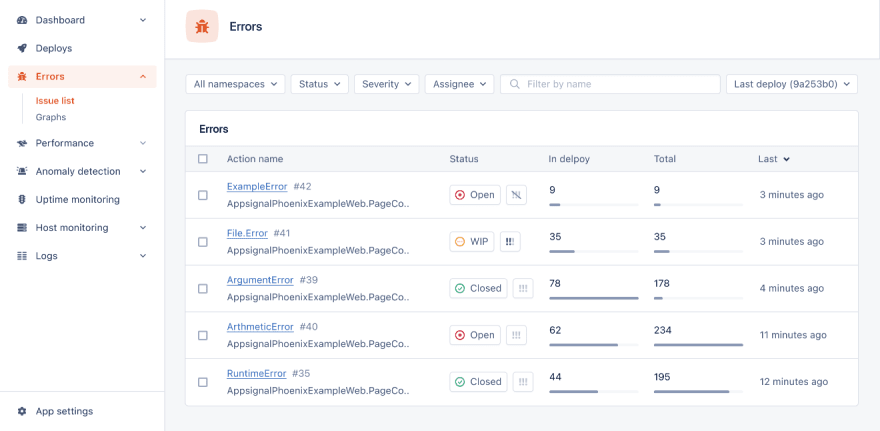
From there, you can dig deeper for more information on individual errors, so you can fix them:

Read more about AppSignal for Elixir.
Wrap Up
This post has introduced debugging basics in Elixir using IO.inspect/2, IEx.pry, and dbg/2. Check out Three Ways to Debug Code in Elixir for some more information.
Next time, we'll focus on Erlang specifically, debugging runtime and finding out how to trace an Elixir clustered application using Erlang's :debugger.
Until then, happy coding!
P.S. If you'd like to read Elixir Alchemy posts as soon as they get off the press, subscribe to our Elixir Alchemy newsletter and never miss a single post!

Top comments (0)