
In part one of this series, the debugging tools we used — Elixir's IO.inspect/2, IEx.pry, and dbg/2 — required us to insert changes into code directly. Outside the development environment, you probably won't (and shouldn't) have access to your code.
Erlang has a few tools to debug code at runtime: :debugger, :dbg.tracer, and :observer.
First, let's look at the :debugger, a graphical debugging tool.
Let's get going!
Debugging Runtime with :debugger in Erlang
Side note: While :debugger has a graphical interface, Erlang also provides :dbg. That's a debugging tool as well, but it uses a text-based interface you can run directly on IEx to achieve the same results.
The very first thing that we need to do is to start the debugger. To do that, we simply call :debugger.start/0:
iex> :debugger.start()
We'll be presented with the debugger graphical interface:

However, to start debugging, we need to tell Erlang's interpreter where to stop.
We can interact with the interpreter using the :int module. We'll use two functions: :int.ni/1 and :int.break/2.
:int.ni/1 tells the interpreter to go over all nodes and
interpret the given module, while :int.break/2 adds a breakpoint in the given line:
# Tell the interpreter to interpret the given module
iex> :int.ni(Messenger.IExClient)
{:module, Messenger.IExClient}
# Add a breakpoint at line 78
iex> :int.break(Messenger.IExClient, 78)
:ok
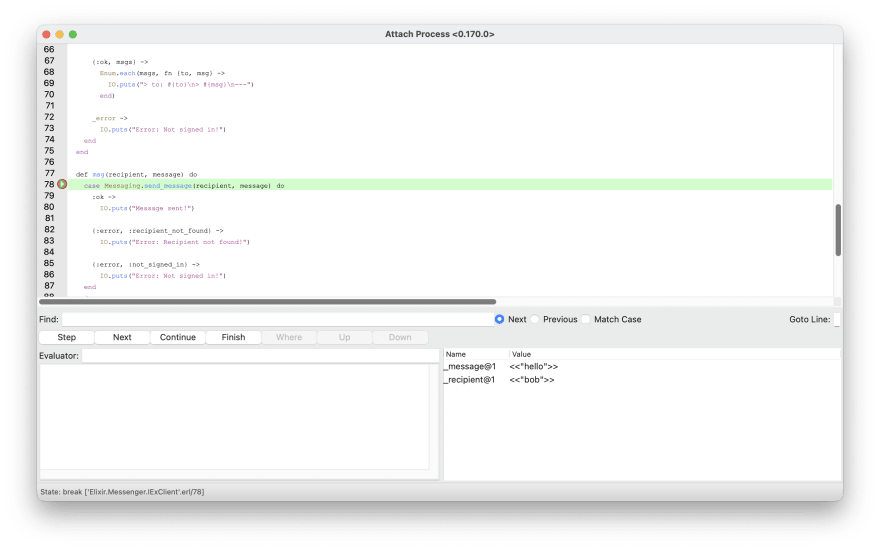
Now, when we try to call the msg/2 function, our code will pause the execution, and the debugger interface will update:

Clicking twice on the breakpoint will open another window, so we can see the exact line of code where execution is paused. In this same window, we can also view all variables in the current execution context (like we did with IEx.pry).
As this is an Erlang tool, it will show the variables from Elixir code in a weird way. Erlang doesn't allow variables to be reassigned. The Elixir compiler has a trick to allow that: variables have versions.
Let's take the following Erlang snippet:
Name = "Jake",
Name2 = string:uppercase(Name).
Note how we have to create another variable to store the result of string:uppercase(Name). We can write this code in Elixir as:
name = "Jake"
name = String.upcase(name)
Behind the scenes, the compiler will automatically version this variable for us.
_name@1 = "Jake"
_name@2 = String.upcase(_name@1)
And that's how we see Elixir variables in the debugger window.
We can add breakpoints at any point in our code and inspect what happens on function calls, loops, recursive functions, etc. And the good thing is that we don't need to modify any lines of code as we did with IO.inspect, IEX.pry, and dbg/2 — but we still need the code to be available.
In the next section, we'll learn about tracing: a way to debug applications at runtime without modifying or having access to the source code.
Tracing (Distributed) Elixir Applications
So far, we've learned how to inspect and debug code and modules. However, sometimes we need to go even further.
Tracing an application means you can track an event starting in one function and follow its execution all the way down into the execution chain — even across the network.
Erlang provides different tools to do that. We'll look into :dbg.tracer (which is text-based) to learn the basics of tracing. Then, we'll use Trace Overview in :observer
(a graphical interface) to trace applications.
Traces with :dbg.tracer
Because we won't use the source code to tell the debugger where to stop, to get the tracer working, we need to set up a few things:
- Start Erlang's debugger
- Start the tracer process
- Select which nodes should be monitored (when in clusters)
- Tell the tracer which processes it should monitor
- Tell the tracer how to detect a function call that should be traced
First, let's start the debugger and tracer processes:
# Start the debugger
iex> :dbg.start()
# Start the tracer
iex> :dbg.tracer()
For now, the tracer will only listen to the local node. We'll change this later.
To configure the process to listen to, we'll use :dbg.p/2 (p stands for process). To keep things simple, we'll listen to all processes:
# listen to all processes
iex> :dbg.p(:all, :c)
Now we need to give the tracer some function call patterns to monitor. To do that, we need function match specs.
Match specs alone require an entire post to explain. To keep it short, think of them as a regex for functions. You can match function calls with specific values and returns, which can be very useful when debugging a problem.
The match pattern we'll use here, [], says that we don't care about the values passed as an argument. Using :dbg.fun2ms, you can write the pattern as a function, and it will generate the match spec for you.
To identify the function to debug, use :dbg.tpl/4. tpl stands for trace pattern local.
In this example, we'll match all GenServer callbacks that
Messaging.MessengerServer implemented:
iex> :dbg.tpl(Messaging.MessengerServer, :handle_call, 3, [])
iex> :dbg.tpl(Messaging.MessengerServer, :handle_cast, 2, [])
iex> :dbg.tpl(Messaging.MessengerServer, :handle_info, 2, [])
Now, whenever we interact with the messenger functions, we'll be notified that it was called:
iex> sign in "alice"
Signed in!
(<0.159.0>) call 'Elixir.Messenger.MessagingServer':handle_call({sign_in,<<"alice">>,nil},{<0.160.0>,[alias|#Ref<0.3934582249.1729953800.172958>]},nil)
:ok
iex> msg "bob", "hello!"
Message sent!
(<0.159.0>) call 'Elixir.Messenger.MessagingServer':handle_call({send,<<"bob">>,<<"hello!">>},{<0.160.0>,[alias|#Ref<0.3934582249.1729953796.173763>]},#{inbox => [],notify_fun => nil,sent => [],user => <<"alice">>})
:ok
We don't need to edit code, load modules, or add breakpoints. The Erlang tracer detects function calls that match our rules and automatically traces them for us.
The log prints, but it is not Elixir-friendly because this tool was designed with Erlang code in mind. However, we can give the tracer a custom function to handle traces. With this function, we can translate the trace information into something that makes more sense to an Elixir developer.
This function will be called for all traces and given the trace information that should be handled, such as:
- caller pid
- module name
- function name
- function arguments
- timestamp
iex> # Custom trace handler
iex> handler = fn data, trace_name ->
...>  case data do
...>    {_, pid, _, {module, fun, args}, timestamp} ->
...>      {{y, mm, d}, {h, m, s}} =  :calendar.now_to_datetime(timestamp)
...>      arg_list = Enum.map(args, &inspect/1)
...>
...>      IO.puts("#{trace_name} :: [#{y}-#{mm}-#{d} #{h}:#{m}:#{s}] (#{inspect(pid)}) #{inspect(module)}.#{fun}(#{Enum.join(arg_list, ", ")})")
...>  end
...> end

# Start tracer with the custom function
iex> :dbg.tracer(:process, {handler, "Initial Data"})
# Include timestamps on traces
iex> :dbg.p(:all, [:call, :timestamp])
Yes, the custom function is not pretty, but it does the job. We have to convert the timestamp from Erlang format to a readable string, and the arg list has to be transformed so we can read the values.
But now, the logged trace looks like it's coming from an Elixir application:
Initial Trace :: [2022-10-20 12:56:48] (#PID<18901.161.0>) Messenger.MessagingServer.handle_call({:sign_in, "bob", nil}, {#PID<18901.162.0>, [:alias | #Reference<18901.2941783407.3368878085.222214>]}, nil)
Now that we know the important concepts around tracing, let's do this in a cluster!
Remote Nodes
So far, we have worked with the local node, but our messenger application is designed to run in a cluster.
By tracing remote nodes, we can view everything that happens - from the moment we send a message in a local node to when it reaches the remote node.
The good news is that we already know most of what's required to do that. We just need to tell the tracer to monitor other nodes using :dbg.n (n stands for node).
To monitor the whole cluster, we iterate over the list of nodes and call :dbg.n/1:
iex> [Node.self() | Node.list()] |> Enum.each(&:dbg.n/1)
Putting it All Together: A Script that Runs a Tracer
Let's create a script that will automatically set up a tracer for us:
# tracer.exs

# Custom trace handler
handler = fn data, trace_name ->
  case data do
    {_, pid, _, {module, fun, args}, timestamp} ->
      {{y, mm, d}, {h, m, s}} =  :calendar.now_to_datetime(timestamp)
      arg_list = Enum.map(args, &inspect/1)

      IO.puts("#{trace_name} :: [#{y}-#{mm}-#{d} #{h}:#{m}:#{s}] (#{inspect(pid)}) #{inspect(module)}.#{fun}(#{Enum.join(arg_list, ", ")})")
  end
end

# Start the debugger process
:dbg.start()

# Start the tracer process
:dbg.tracer(:process, {handler, "Initial Trace"})

# Tell the tracer to monitor all nodes
[Node.self() | Node.list()] |> Enum.each(&:dbg.n/1)

# Tell the tracer to monitor all processes and include a timestamp
:dbg.p(:all, [:call, :timestamp])

# Tell the tracer the function pattern to monitor
:dbg.tpl(Messenger.MessagingServer, :handle_call, 3, [])
:dbg.tpl(Messenger.MessagingServer, :handle_cast, 2, [])
:dbg.tpl(Messenger.MessagingServer, :handle_info, 2, [])
To see it in action, let's start another node with ./start dbg that will just print the trace logs. Load the script above with c "tracer.exs" on iex:
$ ./start dbg
iex> c "tracer.exs"
The new node will see all messages exchanged between node0 and node1, as well as all internal calls:
# alice signs in
Initial Trace :: [2022-10-13 4:42:59] (#PID<18901.159.0>) Messenger.MessagingServer.handle_call({:sign_in, "alice", nil}, {#PID<18901.160.0>, [:alias | #Reference<18901.3988451517.2270494721.161681>]}, nil)

# bob signing in
ok :: [2022-10-13 4:43:8] (#PID<19318.159.0>) Messenger.MessagingServer.handle_call({:sign_in, "bob", nil}, {#PID<19318.160.0>, [:alias | #Reference<19318.2685074897.123797505.34702>]}, nil)

# alice sends "Hello!" to bob
ok :: [2022-10-13 4:43:42] (#PID<18901.159.0>) Messenger.MessagingServer.handle_call({:send, "bob", "Hello!"}, {#PID<18901.160.0>, [:alias | #Reference<18901.3988451517.2270494721.161694>]}, %{inbox: [], notify_fun: nil, sent: [], user: "alice"})

# bob receives "Hello!" from alice
ok :: [2022-10-13 4:43:42] (#PID<19318.159.0>) Messenger.MessagingServer.handle_info({:msg, "alice", "Hello!"}, %{inbox: [], notify_fun: nil, sent: [], user: "bob"})

# bob opens its inbox
ok :: [2022-10-13 4:43:52] (#PID<19318.159.0>) Messenger.MessagingServer.handle_call(:inbox, {#PID<19318.160.0>, [:alias | #Reference<19318.2685074897.123797505.34749>]}, %{inbox: [{"alice", "Hello!"}], notify_fun: nil, sent: [], user: "bob"})
By tweaking the trace handler function and the match specs, we can design powerful tracing scripts to see everything that happens in our application.
The :observer in Erlang
This is another valuable tool with a graphical interface included in Erlang. We can access it from iex by simply typing :observer.start:

There is a lot of information here, and you can even see stats from other nodes!
Trace Overview in :observer
As mentioned, :dbg is a text-based tool for debugging and tracing. But it's also possible to do the same thing using the "Trace Overview" in :observer:

And the steps are the same: select nodes, select processes, and add match specs.
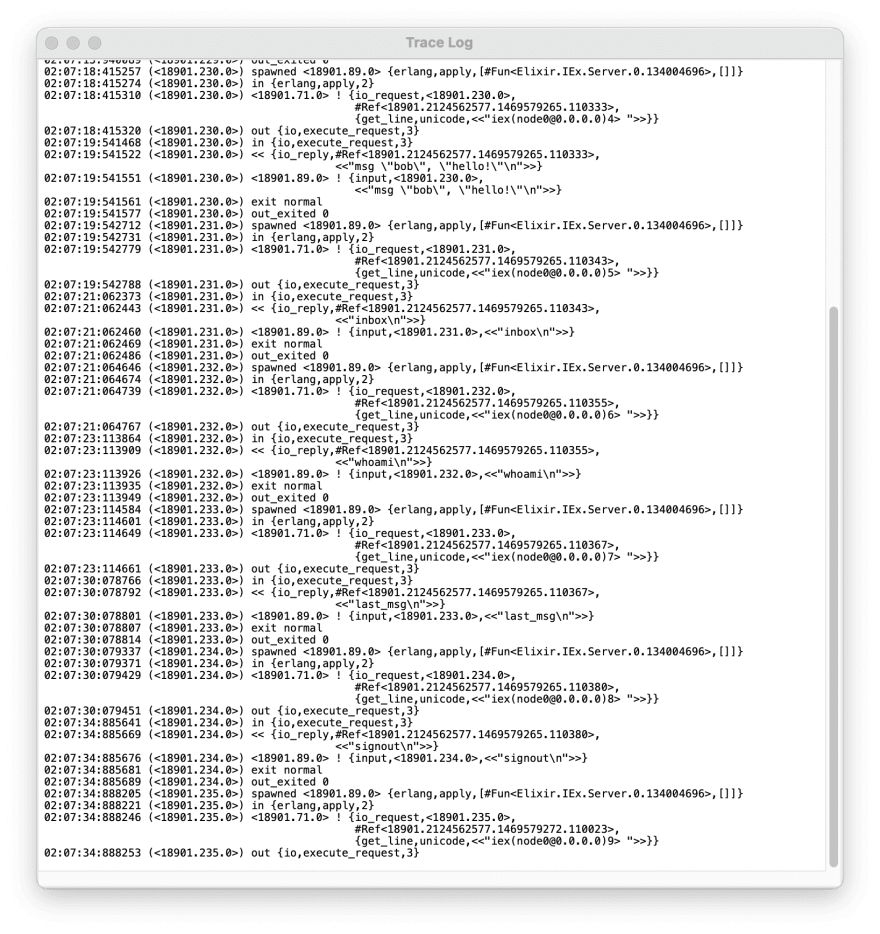
Once you have this configured, hit Start Trace to view the trace logs in a new window:
Debugging Production Apps with AppSignal
AppSignal offers an integration for Erlang.
After you deploy your application to production, AppSignal can help monitor and debug errors from the real world too. You can set it up for your app easily and painlessly — once installed, you'll immediately gain access to the main dashboard, which includes error tracking, alongside some other great features.
Set up alerts, and you'll be instantly notified when errors occur.
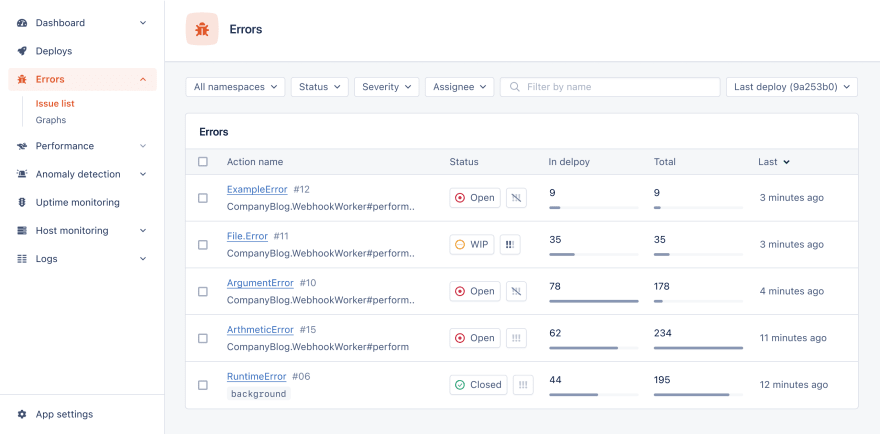
You can drill down to see the root causes of errors and easily fix them from there:

Read more about AppSignal for Elixir.
Wrap Up
In both parts of this series, we put the most important Elixir and Erlang debugging tools into action (with the help of our demo project).
From Elixir's simple IO.inspect/2 to Erlang's powerful tracer, the Erlang ecosystem has tools for all kinds of debugging scenarios. We can use these tools seamlessly, whether locally or in a distributed system.
Happy debugging!
P.S. If you'd like to read Elixir Alchemy posts as soon as they get off the press, subscribe to our Elixir Alchemy newsletter and never miss a single post!

Top comments (0)