
What I built
A data visualization as a service product that enables non-developers to create downloadable charts from their CSV or JSON data as well as developers to create charts using the provided API. It supports file uploads for non-developers, file url where the data can be downloaded and parsed for developers as well as data objects as JSON data. Users can download the data visualization charts and use it in their presentations or within their own apps or any way they see fit and they can title it accordingly so as to be able to access it in future if they come back to the app.
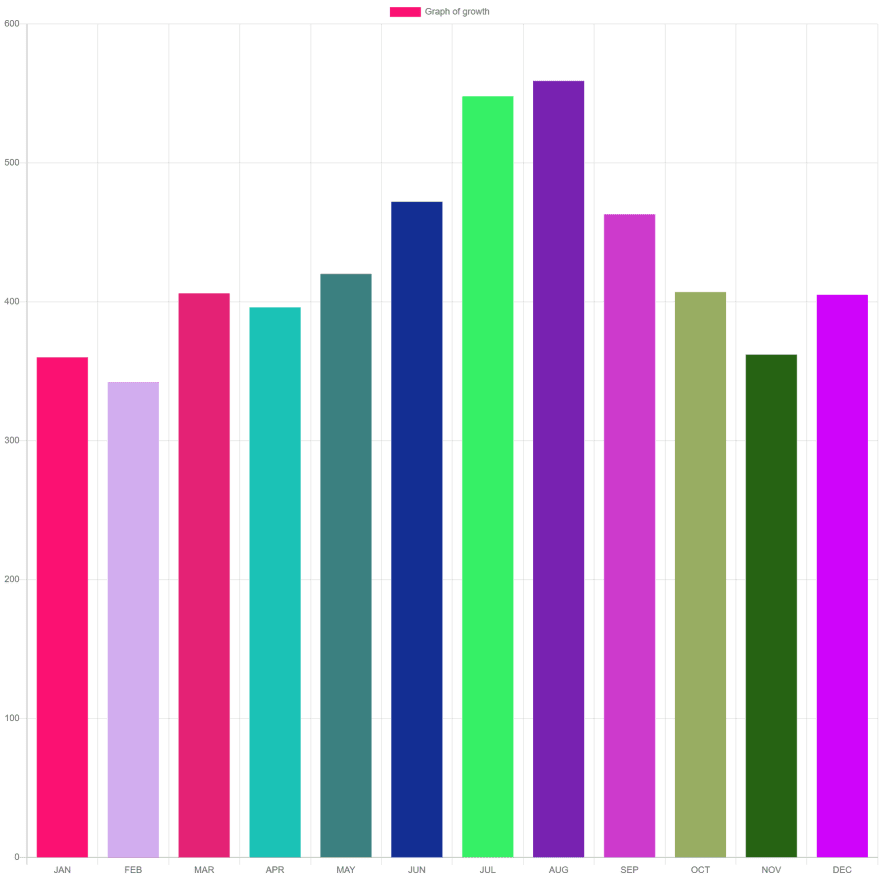
Example visualization output:
Category Submission:
Built for Business
App Link
My app submission can be found here: https://vaasapp.co/
Screenshots
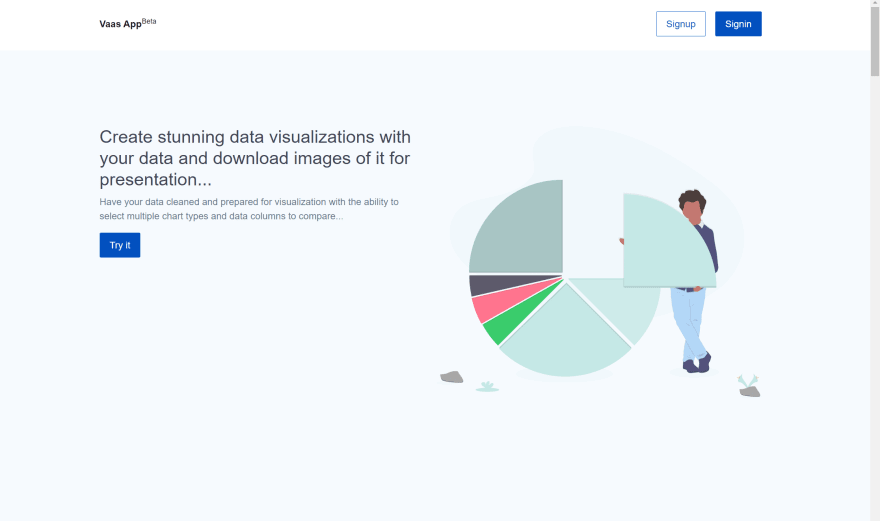
Home page
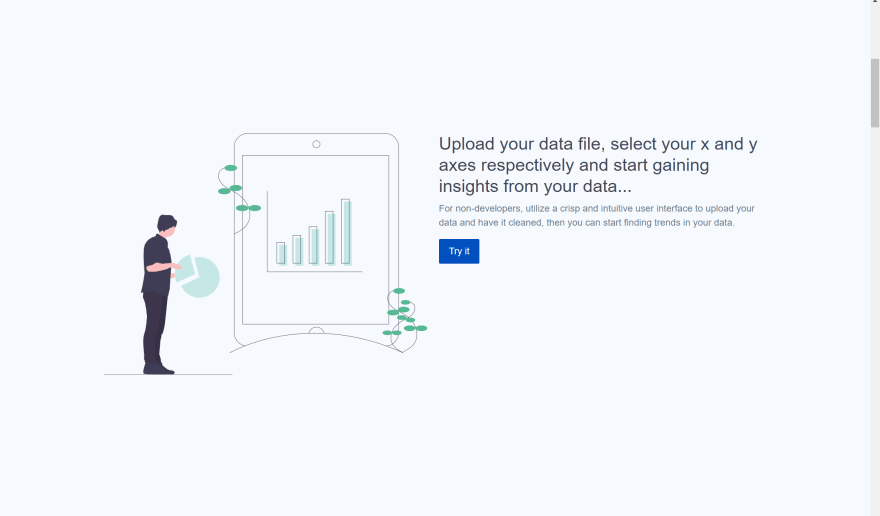
Non-developers call to action
Developers call to action
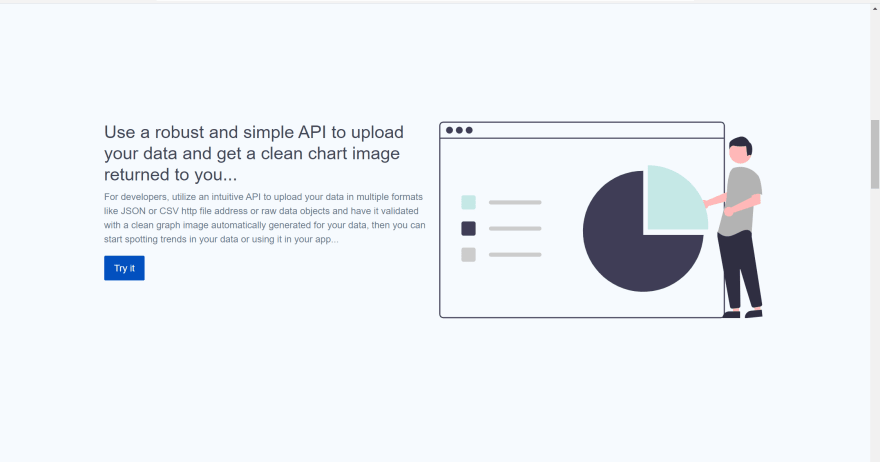
Chart types

Data visualization chart display with download button

Pricing page
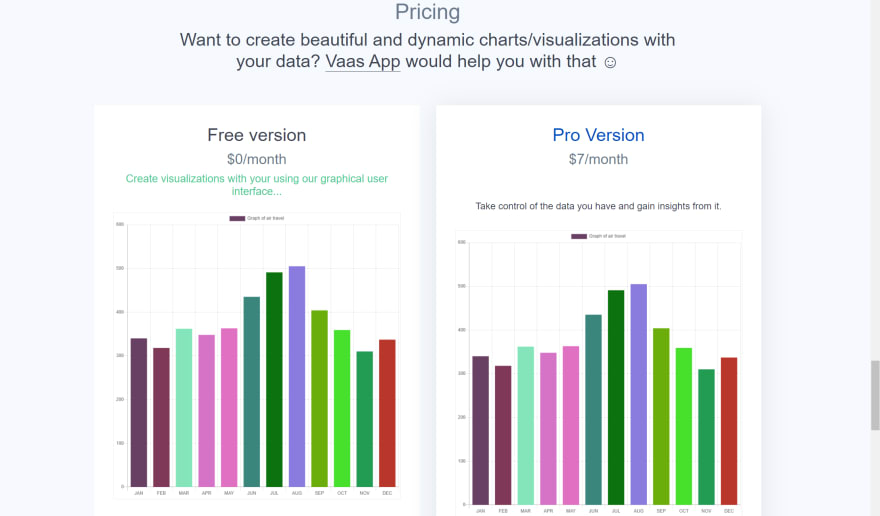
Pricing page options description

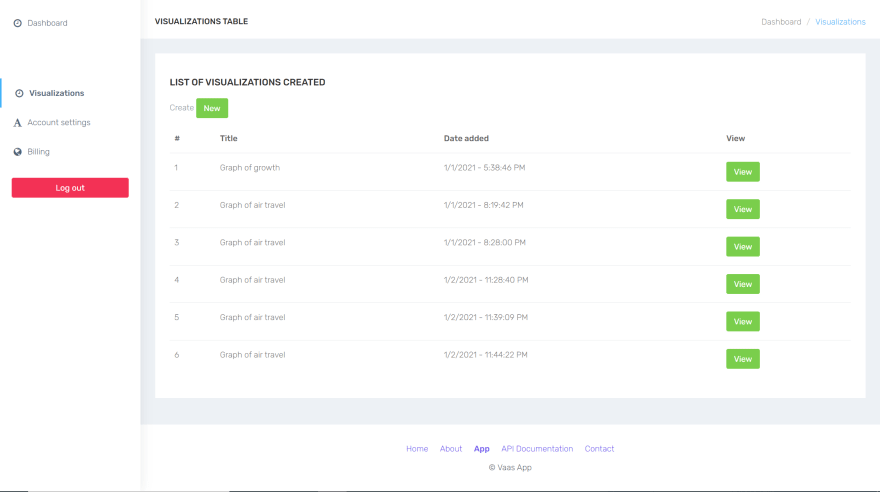
Viewing all created visualizations
Creating a visualization as a non-technical person

Description
The app submission enables non-technical and technical people to create stunning data visualizations using their JSON or CSV data or even raw data objects in HTTP post requests via API. For non-technical people, they can upload their file using the app user interface screen. It can be tried out here: https://vaas-wu4a4.ondigitalocean.app/#try and users of the app can download their data visualizations as PNG images and use it how ever they see fit.
Link to Source Code
https://github.com/ChukwuEmekaAjah/vaas
Permissive License
MIT License
Link: https://github.com/ChukwuEmekaAjah/vaas/blob/master/license.md
Background
The decision to build this particular solution in this contest was spurred by my love for data visualizations. I've always wanted to build a SaaS product that empowers non-developers/non-technical people to create data visualizations of different types with their data easily thereby making it easy for them to get insights from their data. They wouldn't need to know how to use Excel or program in any programming language to be able to create data visualization charts with their CSV or JSON data file. Also, the ability to choose different chart types such as line, pie or bar charts was considered in the capabilities to give to non-technical people since they are the most popular chart types.
In addition to this, bearing in mind that the service can be extended to developers who do not want to go through the process of developing their own visualization service and want to outsource the process to a product, I was motivated to build the product to include developers as prospective customers of the service using a simple-to-use API.
How I built it
In order to build this service, I knew that I needed a Platform-as-a-service product to outsource the handling of hosting and deployment infrastructure. Digital Ocean with its new App platform offering made the process easy to use. Digital ocean's app platform service was easy-to-use and has a competitive pricing structure with app performance insights that would help developers see their product health and status.
The app is built using NodeJS/ExpressJS for the HTTP server and routing, MongoDB for storage, Redis for session storage and Puppeteer for server-side HTML page rendering.
Also, I knew I needed a way to dynamically render data visualization pages for API users and with some Google searches on how I could do that, I got to learn of Puppeteer; the headless chrome engine that can be used on NodeJS servers to render HTML pages. I learnt how to use Puppeteer to dynamically launch browsers and now, I believe I can apply the knowledge learnt to other projects of mine. I also learnt how to deploy apps with Digital Ocean App Platform and it's now a tool in my toolbelt of PaaS providers.
Somehow, I stumbled upon a roadblock in the process of the building the service on the App Platform; the dependencies needed to install Puppeteer on my App instances could not be installed and this led me to do some digging for which I eventually found this link: https://www.digitalocean.com/community/questions/how-to-setup-puppeteer-in-nodejs-app which talks about the fact that the Digital Ocean Engineering team is working to make it possible to use Puppeteer on an app instance. With this setback in mind, I had to extract the Puppeteer component into an external HTTP service so that I could move forward with the app and make it available for developers to consume the API.
Additional Resources/Info
Digital ocean engineering team on work being done to make Puppeteer available
https://www.digitalocean.com/community/questions/how-to-setup-puppeteer-in-nodejs-app
Vaas App Postman API documentation
https://documenter.getpostman.com/view/9506038/TVzNHK6P
Vaas App API documentation
https://vaasapp.co/docs

Top comments (3)
The app looks good and İ liked the idea that the same dataset can be viewed as different charts.
Thank you Rufat. You can as well download the charts as an image. Also, there is an API in case you want to create the charts via HTTP REST methods.
Wow, you have a MVP there. You should look out for investors )