
A I really enjoy making architecture diagrams using Visio, I want to share in a few posts some tips to help you do the same.
This post is the second of this series, the previous one introduced the basic tools of Visio to manipulate the shapes.
This one is about other tools that will help you to better position your shapes, and have nice perfect straight lines between them.
Why I never use PowerPoint for architecture diagrams
As an introduction to shape alignment, here is one thing that bugs me in PowerPoint that make unusable to me for architecture diagrams. In the GIF below I simply select one shape then another, and use the Align middle feature to align them on the same horizontal line:
Align middle in PowerPoint style: both shapes moving towards each other
The behavior I expect when doing this is to use the first selected shape as a reference, so that only the second selected shape will move to align with the first one. And you see what PowerPoint does ? It creates a new reference by merging the position of both shapes 😱
On the other side Visio keeps the position of the first selected shape:
Align middle in Visio style: shapes 2 moves towards shape 1
Which seems like a detail but it makes me happy, as it' much easier to control the position of the shapes like this, especially when working with more than 2 shapes.
Meet the Align tool
Already introduced in the previous section, the align does simply what it says: select several shapes, and use the align tool to left, right, center or middle align them.
Just remember that the first selected shape will not move and be used as a reference, so that the following shapes will align by moving towards the first one. Oh and by the way, it's located in the Arrange section of the Home ribbon:

I almost use only the tool for center and middle align, in the example below I start to arrange these messy shapes by using center align twice and middle align once:
Align tool in action
Using the align tool is a first step toward harmony in architecture diagrams, there is another tool that can help to organize your shapes.
Meet the Position tool
The position tool is the one to use when you need to nicely, evenly position shapes in a diagram. The position tool is located right next to the align tool in the ribbon:
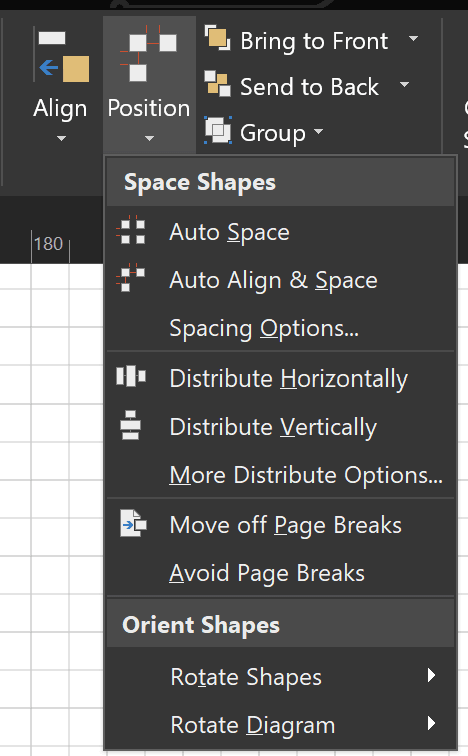
I use mostly the distribute horizontally and distribute vertically, when I have at least 3 shapes to evenly place. Note that with the position tool the shapes at the ends will remain still, only the shapes between them will move.
Let's get back to the previous diagram to see it in action:

Position tool in action
So far we've seen that using the align and position tools together help to control the way we organize shapes in a diagram. But it's mostly useful when used jointly with connections between these shapes, and I have a last tip for that.
Don't be afraid of the ShapeSheet
As I have mentioned in my previous post, Visio comes really handy when connecting shapes together, using the connection and the connection point tool.
However I encourage you to go a step further by using the ShapeSheet to manage connection points. The ShapeSheet is a spreadsheet associated to each shape that can be used to control the shapes properties. Think of it as the F12 key that brings the developers tools of your browser but for Visio.
Beside you have to activate the Visio developer mode to access it but don't freak out, we will only use it for one simple thing.
Once a shape has at least one connection point, I right click on it, I use the Show ShapeSheet menu and organize the Connection Points section to look like this:
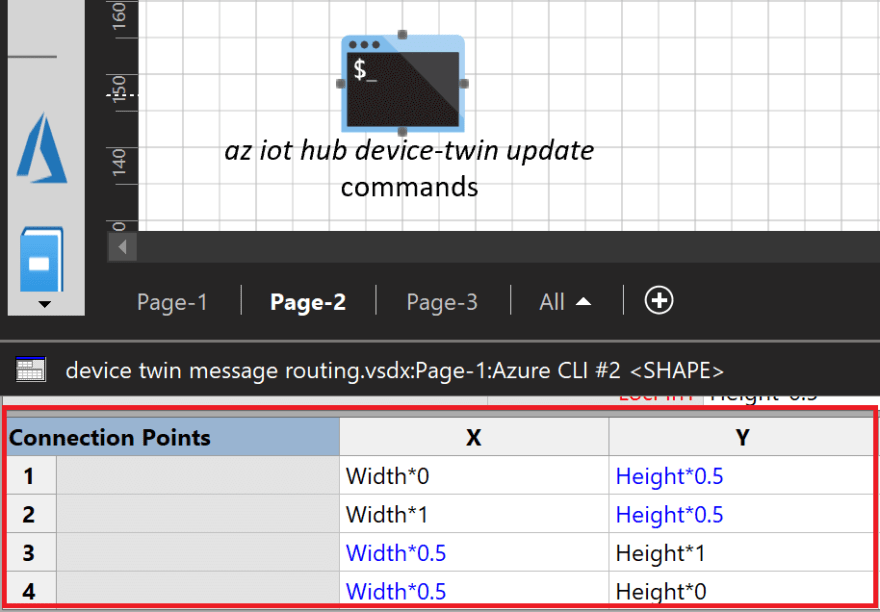
In this section I can add, edit and remove the shapes connection points and set their coordinates as I want using simple formulas using the height and width of the shape. And you can see on the shape in the upper part of the screenshot that the connection point are perfectly placed, way better than if I had placed them "manually".
Of course depending on the use case I can add more connection points, if I have several connections to place on the same side or to start a connection below the shape's text.
But what's really interesting is when I do this for all the shapes on my diagrams, I can then use the align and position tools to place my shapes, and the connections between them will always looks perfectly straight, avoiding those pesky offset pixels that ruin the harmony of a diagram.
See how it looks after the addition of the connections on the previous diagram:
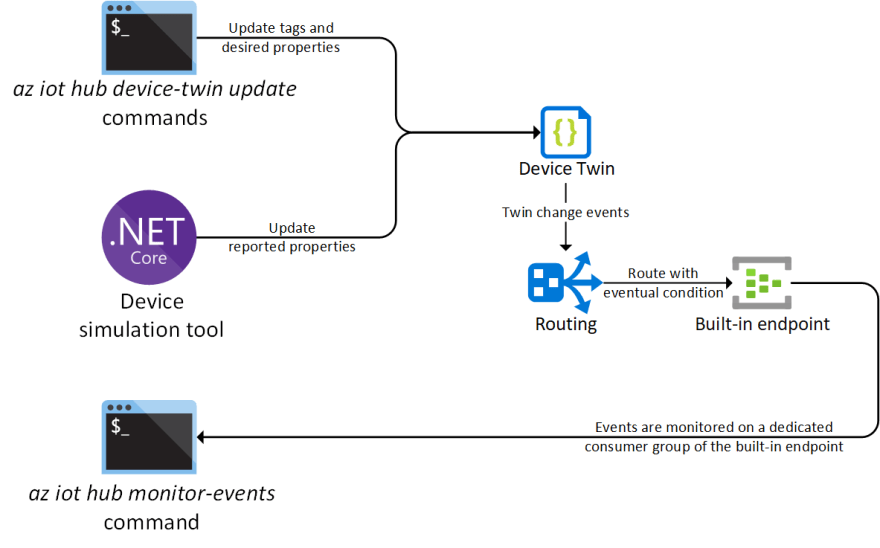
Shapes aligned, position and nicely connected 👌
Wrapping up
That's it for this post, we have seen that using simple shape positioning tools with a more advanced feature like the ShapeSheet make our diagrams start to look really nice. I have a few more tips to share in a last post of this series, I hope these posts associated with some practice will help you to create nice looking diagrams.
Note that the diagram I have use in the examples is issued from this post if you want to check it out 😉

Top comments (0)