AWS introduced a fantastic request tracking solution which permeates throughout some of their better productns. And can be configuration automatically with a simple switch. In lambda all it took was something like this:
// CloudFormation snippet
"LambdaFunction": {
  "Type": "AWS::Lambda::Function",
  "Properties": {
    ...
    "TracingConfig": {
      "Mode": "Active"
    }
  }
}
And now we get some awesome results in X-Ray

Yay! Or wait, where is everything else?
So I recently found some of the requests through DynamoDB taking longer than I wanted. Standup & Prosper (our community standup app) is integrated with--for one Slack--and Slack requires that responses are within 3 seconds. So when a request starts taking a while, my team finds out (we are met with lots of errors returned from Slacks API). But you’ll notice DynamoDB is not here.
And, additionally just tracking DynamoDB isn’t enough, what if I wanted to track performance of my code? You’ll be met with unhelpful documentation through the AWS X-Ray docs. Check it out for yourself here.
Repeated three times in this documentation alone are the words:
Automatic mode is for use with the aws-xray-sdk-express module to support Express applications, however it can be used outside of Express applications.
(Okay for those being pedantic, that line only shows up twice, the their time the word however was replaced with but.)
Don’t worry about that, you probably aren’t using an Express application, but even if you were you still want to know how this works, so I’ll gloss over that part (and get to the good stuff).
There are some interesting aspects that would help to first explain before going further. AWS X-Ray has some unique and esoteric verbiage, and I’m going to define that here:
- AWS X-Ray records traces in a tree format. You start at the root, which might be created for you automatically (if you are using Lambda it will have been, for other services it isn’t) To create that you would have needed to do this:
const segment = new AWSXRay.Segment('ROOT' /\* or something \*/);
AWSXRay.setSegment(segment);
- Segment: this is a node of tree. Create one of this to start tracking. When lambda starts there is already an existing segment. When you are done tracking, close the segment.
- AWS Concepts page, in case you were interested, but unhelpful
That’s really it, but it is a bit difficult to understand what is going without those two concepts. Also ignore the rest of the documentation it won’t be helpful.
Now on to real topic. If you just wanted to create some X-Ray traces, store, and use them. You are in luck. Call new AWSXRay.Segment as I’ve described above and start using it:
const segment = new AWSXRay.Segment('ROOT');
// You can search through annoations
segment.addAnnotation('indexedData', 'value');

// You cannot search through metadata
segment.addMetadata('NonIndexedData', 'value');
segment.close();
And you’re done!
Wait a sec, why is this completely separated from the lambda’s tracing… You’ll see this segment is a separate node on your graphs, completely disconnected.
Okay so it turns out that Lambda keeps track of segments for you and generates them, however there is a catch, you can’t use any of the nice functionality that X-Ray provides because you can’t actually interact with the segment created by Lambda!
Don’t bother trying. There is no shortage of the number of complaints about this topic
The Lambda segment as seen on the X-Ray console is created in the Lambda’s runtime start-up code, and is sent asynchronously and independent from the X-Ray SDK. Thus, the facade segment is a placeholder, which only contains the trace it/parent id/sampling decision that Lambda created. It is never meant to be sent..
Huh? So, whatever.
The AWS X-Ray SDK has two modes: manual and automatic. By default, the SDK is in automatic mode. You can flip the mode of the SDK using the following:
And by default this is also confusing. Ignore this, we’ll be using the default in lambda.
That’s nice and all, but I still want my traces to appear in the same X-Ray graph. You got it. Because the docs don’t cover this, I’ve created a simple sample to go from:
First, install an actual working version of the core library. For some reason this isn’t the default, although Lambda supports async, the X-Ray library does not. (and I’m sorry that this directly depends on aws-sdk install of listing it as a peer-dependency that means you are pulling in everything to lambda package. But there is a suggestion Github issue to support a similar change.)
npm install aws-xray-sdk-core@2.3.6-experimental.1
A single class to contain begin and end to handle the tracing of a part of code:
const AWSXRay = require('aws-xray-sdk-core');
AWSXRay.middleware.disableCentralizedSampling();
AWSXRay.capturePromise();
AWSXRay.captureAWS(require('aws-sdk'));
AWSXRay.captureHTTPsGlobal(require('http'));
AWSXRay.captureHTTPsGlobal(require('https'));

class XrayManager {
  constructor() {
    this.parentSegment = null;
  }

  begin(type, request) {
    this.parentSegment = AWSXRay.getSegment();
    if (!this.parentSegment) {
      return;
    }

    const segment = this.parentSegment.addNewSubsegment(type);
    // make this the new parent of all future segments
    AWSXRay.setSegment(segment);
    if (request) {
      // Duplicate this information because Lambda doesn't support
      // the default tracking on the parent segment because it isn't real
      segment.addAnnotation('HttpMethod', request.httpMethod);
      segment.addAnnotation('Route', request.route);
      segment.addAnnotation('URL', request.path);

      segment.http = new AWSXRay.middleware.IncomingRequestData({
        headers: {
          'x-forwarded-for': request.headers['X-Forwarded-For'],
          'user-agent': request.headers['User-Agent'],
          'host': request.headers.Host
        },
        method: request.httpMethod,
        url: request.path,
        connection: { secure: request.headers['X-Forwarded-Proto'] === 'https' }
      });
    }
  }

  end(response, error) {
    if (!this.parentSegment) {
      return;
    }
    const segment = AWSXRay.getSegment();
    if (response) {
      segment.addAnnotation('StatusCode', response.statusCode);
      if (response.statusCode === 429) {
        segment.addThrottleFlag();
      }
      if (AWSXRay.utils.getCauseTypeFromHttpStatus(response.statusCode)) {

   segment[AWSXRay.utils.getCauseTypeFromHttpStatus(response.statusCode)] = true;
      }
      segment.http.close(response);
    }
    segment.close(error);
    // pop the stack by reseting the parent segment
    AWSXRay.setSegment(this.parentSegment);
  }
}

module.exports = XrayManager;
And then all you need to do is
// Before the request
const XrayManager = new XrayManager();
XrayManager.begin('ApiRequest', requestObject);
const responseObject = await request(requestObject);
XrayManager.end(responseObject);
And full tracking for this request shows up, with child requests inside of the newly created Segment.
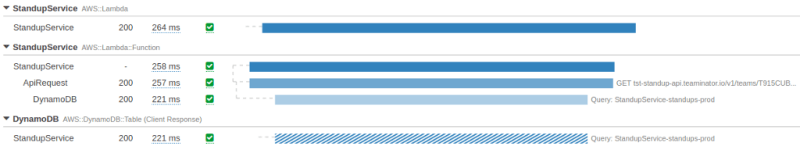
The top level Lambda Segment prevents things like the method and status code from working:
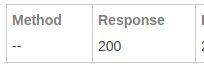
Which means if you want them, you’ll need to create a completely separate segment from the current one and this will create an unnecessary node on your X-Ray graph. Additionally the x-amzn-trace-id from the API Gateway response won’t match the one created in X-Ray, which means tracking this now becomes a huge pain.
But there it is, hopefully this helps someone else out. And there is still yet one more caveat. You did everything right you think, BUT the X-Ray SDK emitter is UDP and tracked separately from your lambda code. You can’t await it. So when you create some segments they won’t actually show up in X-Ray until at one more lambda is execution is run. That follow up execution will allow the previous code to complete.
You might be thinking oh context.callbackWaitsForEmptyEventLoop = true; will do the trick, great, try it out and see what happens. Turns out there is a bug in async handling for Nodejs8.0 (and perhaps Lambda Nodejs10.x) when returning anasync function result, that property doesn’t work.

Top comments (0)