This guide will tell you what is Google BigQuery, how can it leverage your data analyses and what cool features Google BigQuery offers that makes it a perfect solution for data warehousing.
Let’s start first talking what is data warehouse:
According to AWS: A data warehouse is a central repository of information that can be analyzed to make better informed decisions.
So basically, it is to extract all the data you can from different sources, and store them in a structured way in a central storage, where you will be able to do queries and generate insights and take decisions from data.
So, what is BigQuery?

BigQuery is Google’s fully managed, petabyte scale, low cost analytics data warehouse.
Fully managed: Plug and play, user doesn’t have to care about nothing in terms of infrastructure.
Petabyte scale: Quickly analyze gigabytes to petabytes of data.
Low cost analytics: Analyze up to 1 TB of data and store 10 GB of data for free each month. So, you can use it even without paying anything, only data storage, which is pretty cheap.
Google BigQuery has a lot of cool feature, but its more remarkable are:
- NoOps.
- Pay-as-you-go model.
- Securely share insights.
- Streaming ingestion captures and real time analyses.
- Analyze up to 1 TB of data and store 10 GB of data for free each month.
One of the coolest things about Google BigQuery is its constant evolution and progress:
In 2016, on GCP Next, a query that represented a Petabyte took 245.7s (about 4 min).
In 2018, the same query over the same dataset took 1 min 53s. The difference was not in the performance but in the way data was analyzed (data was clustered and partitioned on the dataset).
In 2019, on Google Next, only 11s! were needed for the same query.
These facts are explained in this video:
The video also explains what is the difference between a traditional data warehousing and what BigQuery offers, I will try to summarize that here:
Traditional approach for data warehousing:
This approach is built using an event handler (e.g., Kafka)+ data warehouse (DW, e.g., Apache Hive) + transformation jobs, pipelines (e.g., Hadoop, Spark, Impala) + Any analytic tool for doing queries and create dashboards (e.g., Hive + Tableau). This architecture can process data in batches (historic data stored) and also in real-time (streaming data coming from sensors). However, there is crucial word that characterizes this approach: “on-prem”. What this means? That someone will have to install all these technologies in your data center or in machine and pay for all these resources even if they are not being used.

BigQuery modern data warehousing:

So, one of the coolest thing about BigQuery, is the separation of storage and computing, someone can scale up the storage infinitely and keep the same computing. Also someone can scale up computing without having to scale storage (All this is possible thanks to Google’s petabit network).

BigQuery Architecture — Petabit Network
It is also serverless. It is ready to use.
Also brings the possibility of doing real-time analyses (thanks to combine it with Google Dataflow), instead of the traditional approach where someone have to dump the data for a period of time to see what happened in that period (delayed results).
Centralized storage: Data is accessible to all tools which can leverage it (BI, ETL tools, Hadoop, ML tools, and so on). There is a bunch of connectors that read in parallel, without affecting one another.
Security: Detailed logs of what happened.
Sharing: Grant people access to your data (specially, using views of queries and analyses).

Predictive: BigQuery ML. What is going to happen tomorrow!
Models can be built based on the data in your data warehouse.
BigQuery ML:
There are several algorithms already implemented someone can use to make predictions.

In the video, they mentioned that they took the Netflix dataset, for recommendations, they used a Matrix factorization algorithm, and obtained results more or less equivalent than the best results. Only because they were able to process the whole dataset, not because of the fanciness of the algorithm.
For neural networks (Alpha), Google ships the data to Cloud ML Engine, but all is transparent for the user.
Auto ML Tables:
Someone can point a BigQuery Table and generate a model without having a special degree in ML. Only setting what is the outcome that is wanted to be predict.

What is the difference with BigQuery ML?
AutoML is a black box, high accuracies can be obtained easily (in my experience with AutoML for images, overfitting is easy to obtain too, that’s why a good validation and test strategy must be taken into account).
BigQuery ML uses simpler models, easier to understand. Variables that produce the outcome can be also identified. However, it does require some knowledge in ML.

Full list of features:
- Serverless: Google does all resource provisioning.
- Real-time analytics: (Near real-time)
- Automatic high availability: Replicated storage in multiple locations
- Standard SQL: Reduces code rewrites (Columnar database)
- Federated query and logical data warehousing: Several external sources
- Storage and compute separation: Every column is stored in a separated file.
- Meant for immutable pretty large datasets. (Not a transactional DB)
- Automatic backup and easy restore: Seven-day history of changes.
- Geospatial data types and functions: SQL support for GeoJSON and WKT. More data is becoming to have location associate with it. Query directly from maps.
- Data transfer service
- Big data ecosystem integration: Dataproc and Dataflow connectors
- Petabyte scale
- Flexible pricing models
- Data governance and security: Security with fine-grained identity
- Geoexpansion: Geographic data control.
- Foundation for AI
- Foundation for BI
- Flexible data ingestion
- Programmatic interaction: REST API
- Rich monitoring and logging with Stackdriver
Google Warehousing Architecture:

Use cases:
Before Google BigQuery had in its documentation like four main use cases, right now you can find a bunch of them here. Let’s summarize a little bit two of them, which have the common steps involved in data engineering.
1. Internet of things:

Google Cloud IoT is a complete set of tools to connect, process, store, and analyze data both at the edge and in the cloud.
Use cases:
- Predictive maintenance
- Real-time asset tracking
- Logistics & supply chain management
- Smart Cities & Buildings
More info can be found here:
Taken from:
Overview of Internet of Things | Solutions | Google Cloud
2. Optimizing Large-Scale Ingestion of Analytics Events and Logs:
In this architecture, data originates from two possible sources:
- Analytics events are published to a Pub/Sub topic.
- Logs are collected using Cloud Logging.
Benefits:
- Log integrity. No logs are lost due to streaming quota limits or sampling.
- Cost reduction. Logs inserted in Cloud Storage using batch jobs.
- Reserved query resources. Moving lower-priority logs to batch loading.

Streaming input: Immediate analysis, e.g., an event might indicate undesired client behavior or bad actors.

Batch process: Events that need to be tracked and analyzed on an hourly or daily basis.

Streaming input: Critical logs.

Cold path: Don’t require near real-time analysis.

Taken from:
Architecture: Optimizing large-scale ingestion of analytics events and logs
Datasets:
Commercial:
Commercial data providers are accelerating your time to insight by hosting their data offerings directly in BigQuery, Cloud Storage and Cloud Pub/Sub.
Examples:
- AccuWeather: min/max temperatures, precipitation, and snowfall
- Dow Jones: historical News Snapshots
- HouseCanary: historical home price
- Xignite: financial market data
Public:
A public dataset is any dataset that is stored in BigQuery and made available to the general public through the Google Cloud Public Dataset Program.

Costs (March 24, 2020):
Active storage: $0.020 per GB.
Long-term storage: $0.010 per GB. If a table is not edited for 90 consecutive days, the price of storage for that table automatically drops by approximately 50 percent.
Streaming Inserts: $0.010 per 200 MB. You are charged for rows that are successfully inserted. Individual rows are calculated using a 1 KB minimum size.
Queries (on-demand): First 1 TB per month is free. $5.00 per TB
Pricing | BigQuery: Cloud Data Warehouse | Google Cloud
Now, what you are really interested in:
Examples:
- Let’s start with the simple one. Loading a CSV.
Before loading a CSV, let’s review some important concepts:
1.1. Schemas: BigQuery allows you to specify a table’s schema when you load data into a table, and when you create an empty table.
When you specify a table schema, you must supply each column’s name and data type. You may optionally supply a column’s description and mode.
A column name cannot use any of the following prefixes:
- _TABLE_
- _FILE_
- _PARTITION
These are reserved name of BigQuery architecture.
1.2. Data types:
- Integer: Numeric values without fractional components.
- Floating point: Approximate numeric values with fractional components.
- Numeric: Exact numeric values with fractional components.
- Boolean: TRUE or FALSE (case insensitive).
- String: Variable-length character (Unicode) data.
- Bytes: Variable-length binary data.
- Date: A logical calendar date.
- Datetime: A year, month, day, hour, minute, second, and subsecond.
- Time: A time, independent of a specific date.
- Timestamp: An absolute point in time, with microsecond precision.
- Struct (Record): Container of ordered fields each with a type (required) and field name (optional).
- Geography: A pointset on the Earth’s surface (a set of points, lines and polygons on the WGS84 reference spheroid, with geodesic edges).
1.3 Loading example:
Let’s download a CSV from any Kaggle challenge, for instance:
COVID-19 Open Research Dataset Challenge (CORD-19)
Click on:

From that folder get the file: all_sources_metadata_2020–03–13.csv
Go to console.cloud.google.com:
Click on projects and create a new project:


Set any name, and then go to: https://console.cloud.google.com/bigquery
If you don’t a billing account you will have to set one before creating a dataset:

Now, we can create a dataset:

The following overlay will appear:

Let’s call the dataset “coronavirus”. And the remaining options can be left in their default option. They are more related on how is the data is going to be stored.
On the left, click on:

Now, we can click on Create Table:

Another overlay will appear:

So, normally we would select Create Table From: Upload. However, as our file has a size higher than 10MB, we have to upload it from Cloud Storage.

Go to https://console.cloud.google.com/storage/create-bucket
Create a bucket called “datasets-any-other-unique-id”.

You can drag and drop now the file in the bucket. Btw, if it prompts an error of permissions, just reload the page.
Clicking on the file name we can get the URI of the file, we will use it to load the file in BigQuery:

We are going to create the dataset in BigQuery using Auto Detect Table Schema, which I don’t recommend, I won’t get all the correct data types for your columns, but it’s okay for this example:

Click at the bottom in Create Table. We will end with a table like this one:

Also we will be able to watch a preview of the dataset in Preview:

1.4. Some queries:
Let’s check which dates are available for the articles in our dataset.
SELECT DISTINCT(publish_time) FROM `${project_name}.coronavirus.all_sources_autoschema`

Let’s look for the word success in a abstract:
String functions | BigQuery | Google Cloud
SELECT
  abstract
FROM
  `${PROJECT_ID}.coronavirus.all_sources_autoschema`
WHERE
  REGEXP_CONTAINS( abstract, r"(?i:SUCCESS)")

And there are a bunch of utilities we can find there for strings.
We can also check how has the research been evolved in terms of the COVID-19:

And which are the journal who have contributed more in the topic:
SELECT
  journal,
  COUNT(journal)
FROM
  `${PROJECT_ID}.coronavirus.all_sources_autoschema`
GROUP by journal ORDER BY COUNT(journal) DESC

BigQuery ML:
Let’s go to:
COVID19 Global Forecasting (Week 1)
And download the data, essentialy, train.csv:

Load that in BigQuery as a Table:

Then create a Table:
Seems that we had had lucky with Auto detecting schema:

This is the preview:

Let’s see what countries we have:
SELECT DISTINCT(Country_Region) FROM `${PROJECT_ID}.coronavirus.corona_prediction`
See that always before sending a query, BigQuery makes an estimate of how many data will be processed:
![]()
Let’s focus our analysis in Spain:
SELECT * FROM `${PROJECT_ID}.coronavirus.corona_prediction` WHERE Country_Region LIKE 'Spain'
We can go to DataStudio and see how this data is behaving over the time:

Select Time series chart:

On the right panel set Dimension, as date:

And on metric click on Confirmed Cases and Fatalities:
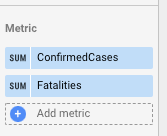
We will obtain a chart like this one:

What if we create a model to predict the amount of Confirmed Cases over the time?
Creating a model has a bunch of parameters, but we can start with the simple one:
CREATE MODEL
  `${PROJECT_ID}.coronavirus.model_0`
OPTIONS
  ( MODEL_TYPE='LINEAR_REG',
    input_label_cols=['ConfirmedCases'] ) AS
SELECT
  Date,
  ConfirmedCases
FROM (
  SELECT * FROM `${PROJECT_ID}.coronavirus.corona_prediction` WHERE Country_Region LIKE 'Spain'
)


Smells like overfitting, but we can continue with this…
We can predict now using for example the same train dataset for spain:
SELECT Date FROM `${PROJECT_ID}.coronavirus.corona_prediction` WHERE Country_Region LIKE 'Spain'
The query will look like this:
SELECT * FROM ML.PREDICT(MODEL `${PROJECT_ID}.coronavirus.model_0`, (SELECT Date FROM `${PROJECT_ID}.coronavirus.corona_prediction` WHERE Country_Region LIKE 'Spain'))
Let’s combine train and test and plot them, we are going to create
SELECT Date, predicted_ConfirmedCases AS ConfirmedCases, IF(true, 'test', 'disabled') AS DATASET FROM ML.PREDICT(MODEL `${PROJECT_ID}.coronavirus.model_0`, (SELECT Date FROM `${PROJECT_ID}.coronavirus.corona_test` WHERE Country_Region LIKE 'Spain'))

UNION ALL

SELECT Date, ConfirmedCases, IF(true, 'train', 'disabled') AS DATASET FROM `${PROJECT_ID}.coronavirus.corona_prediction` WHERE Country_Region LIKE 'Spain'
As we see in the plot, we created a model that overfits perfectly of train data, but what happens after we don’t have more days? It seems pretty weird:

First, a model cannot be based only on the date, more than that probably Date is not being interpreted in the model as sequence with monotonic increment. So let’s do that again with Date as a TIMESTAMP. We will do the same queries but casting Date to TIMESTAMP.
Creating a model:
CREATE MODEL
  `${PROJECT_ID}.coronavirus.model_timestamp`
OPTIONS
  ( MODEL_TYPE='LINEAR_REG',
    input_label_cols=['ConfirmedCases'] ) AS
SELECT
  Date,
  ConfirmedCases
FROM (
  SELECT CAST(Date as TIMESTAMP) AS Date, ConfirmedCases FROM `${PROJECT_ID}.coronavirus.corona_prediction` WHERE Country_Region LIKE 'Spain'
)
Metrics:

Looks better, more credible.
Now, run again both queries, only for train data:
SELECT Date, predicted_ConfirmedCases AS ConfirmedCases, IF(true, 'test', 'disabled') AS DATASET FROM ML.PREDICT(MODEL `${PROJECT_ID}.coronavirus.model_timestamp`, (SELECT CAST(Date as TIMESTAMP) AS Date FROM `${PROJECT_ID}.coronavirus.corona_prediction` WHERE Country_Region LIKE 'Spain'))

UNION ALL

SELECT CAST(Date as TIMESTAMP) AS Date, ConfirmedCases, IF(true, 'train', 'disabled') FROM `${PROJECT_ID}.coronavirus.corona_prediction` WHERE Country_Region LIKE 'Spain'
Now, the plot makes more sense!

And for train and test data:
SELECT Date, predicted_ConfirmedCases AS ConfirmedCases, IF(true, 'test', 'disabled') AS DATASET FROM ML.PREDICT(MODEL `${PROJECT_ID}.coronavirus.model_timestamp`, (SELECT CAST(Date as TIMESTAMP) AS Date FROM `${PROJECT_ID}.coronavirus.corona_test` WHERE Country_Region LIKE 'Spain'))

UNION ALL
SELECT CAST(Date as TIMESTAMP) AS Date, ConfirmedCases, IF(true, 'train', 'disabled') FROM `${PROJECT_ID}.coronavirus.corona_prediction` WHERE Country_Region LIKE 'Spain'

We should submit that on Kaggle and maybe become rich! I’m kidding, we need still a lot of work here.


Top comments (0)