As a passionate Pythonista deeply involved in web application development, I'm always on the lookout for tools that can boost my productivity. Streamlit has long been a trusted companion, valued for its user-friendliness and rapid prototyping capabilities. However, my recent discovery of Panel has ignited my curiosity.
In this blog post, I won't be drawing comparisons between Streamlit and Panel. Instead, I'll be your guide on a journey to explore Panel independently, delving into its unique strengths and applications. By the conclusion of this exploration, you'll have a comprehensive view of how Panel could revolutionize your approach to Python web development.
To fully grasp Panel's potential, I decided to create a stock tracking application using this framework. Through this hands-on experience, I aim to highlight the capabilities and possibilities that Panel offers, giving you valuable insights into its role in modern web development.
If you're ready, here we go!
Because I'm using Windows, I open CMD and use pip to install the package. I'd like to point you that the package's most recent version is 1.2.2. Panel works with Python 3.8 or later on Linux, Windows, and Mac.
pip install panel
We will first retrieve stock data and generate a chart using the yfinance package. This can be viewed as a form of warm-up exercise.
import yfinance as yf
import pandas as pd

def get_stock_data(stock_symbol, start_date, end_date, frequency='1d'):

    stock_data = yf.download(
        stock_symbol,
        start=start_date,
        end=end_date,
        interval=frequency,
        progress=False
    )

    return stock_data
The code above defines a Python function used to download Yahoo Finance data for the specified stock symbol. The function can be called with parameters such as the start date, end date, and data frequency. Using the yfinance library, the function downloads price data for the specified stock symbol and converts it into a Pandas DataFrame. Finally, it returns this DataFrame.
import yfinance as yf
import pandas as pd
import hvplot.pandas

def get_stock_data(stock_symbol, start_date, end_date, frequency='1d'):

    stock_data = yf.download(
        stock_symbol,
        start=start_date,
        end=end_date,
        interval=frequency,
        progress=False
    )

    return stock_data

def plot_stock_data(stock_symbol, start_date, end_date, frequency, column='Adj Close'):
    stock_data = get_stock_data(stock_symbol, start_date, end_date, frequency)
    stock_data = pd.DataFrame(stock_data)[[column]].rename(columns={column:stock_symbol})
    return stock_data.hvplot(
        title=f"{stock_symbol}",
        ylabel='',
        xlabel=''
    )
The code above defines a Python function that generates a plot for the stock price data of a given stock symbol within a specified date range and frequency.
import yfinance as yf
import pandas as pd
import hvplot.pandas

def get_stock_data(stock_symbol, start_date, end_date, frequency='1d'):

    stock_data = yf.download(
        stock_symbol,
        start=start_date,
        end=end_date,
        interval=frequency,
        progress=False
    )

    return stock_data

def plot_stock_data(stock_symbol, start_date, end_date, frequency, column='Adj Close'):
    stock_data = get_stock_data(stock_symbol, start_date, end_date, frequency)
    stock_data = pd.DataFrame(stock_data)[[column]].rename(columns={column:stock_symbol})
    return stock_data.hvplot(
        title=f"{stock_symbol}",
        ylabel='',
        xlabel=''
    )

plot_stock_data(stock_symbol='THYAO.IS', start_date='2023-01-01', end_date='2023-09-06', frequency='1d')
Running the above code will generate an interactive plot showing the daily adjusted closing prices for Turkish Airlines stock (THYAO.IS) from 2023/01/01 to 2023/09/06. You can interact with the plot to explore the stock price data during this period.
Now we can move on to the use of the Panel in its simplest form.
You can edit your Panel code as a .py file in any editor or IDE, marking the objects you want to render as .servable().
import yfinance as yf
import pandas as pd
import hvplot.pandas
import panel as pn

def get_stock_data(stock_symbol, start_date, end_date, frequency='1d'):

    stock_data = yf.download(
        stock_symbol,
        start=start_date,
        end=end_date,
        interval=frequency,
        progress=False
    )

    return stock_data

def plot_stock_data(stock_symbol, start_date, end_date, frequency, column='Adj Close'):
    stock_data = get_stock_data(stock_symbol, start_date, end_date, frequency)
    stock_data = pd.DataFrame(stock_data)[[column]].rename(columns={column:stock_symbol})
    return stock_data.hvplot(
        title=f"{stock_symbol}",
        ylabel='',
        xlabel=''
    )

plot = plot_stock_data(stock_symbol='THYAO.IS', start_date='2023-01-01', end_date='2023-09-06', frequency='1d')

pn.Column(plot).servable()
In the code snippet above, we use plot_stock_data to create a plot of the stock symbol 'THYAO.IS' for the specified time frame and frequency. Then, we arrange this plot in a Panel column layout and make it servable, allowing us to display it as a web-based dashboard.
In order to view and interact with the created plot, we need to run the application using the following command in our terminal, which can be written in Visual Studio Code or any other code editor:
panel serve app.py --show --autoreload
Here's what this command does:
-
panel serve: This command tells Panel to serve the application. -
app.py: Replace this with the name of your Python script containing the Panel application code. -
--show: This option opens a new web browser window/tab to display the application. -
--autoreload: It enables automatic reloading of the application when changes are made to the code.
After running the command, the application will be accessible at the following URL: http://localhost:5006/app. This URL means that the application is running on our local machine (hence "localhost"), and it's accessible through port 5006. The "/app" path is determined by the structure of our Panel application.

We can add widgets to the app to make it more dynamic. A "widget" is a small component or module of a web application that is used to display a single function or piece of information in the user interface. Widgets can be embedded in web sites or applications and provide a variety of functions.
Allow users to choose a date range.
import yfinance as yf
import pandas as pd
from datetime import datetime
import hvplot.pandas
import panel as pn

datetime_range_picker = pn.widgets.DatetimeRangePicker(
    name='Datetime Range Picker',
    value=(datetime(2023, 1, 1), datetime(2023, 9, 6))
)

def get_stock_data(stock_symbol, start_date, end_date, frequency='1d'):
    stock_data = yf.download(
        stock_symbol,
        start=start_date,
        end=end_date,
        interval=frequency,
        progress=False
    )
    return stock_data

def plot_stock_data(stock_symbol, start_date, end_date, frequency, column='Adj Close'):
    stock_data = get_stock_data(stock_symbol, start_date, end_date, frequency)
    stock_data = pd.DataFrame(stock_data)[[column]].rename(columns={column: stock_symbol})
    return stock_data.hvplot(
        title=f"{stock_symbol}",
        ylabel='',
        xlabel=''
    )

@pn.depends(datetime_range_picker.param.value)
def update_plot(date_range):
    start_date, end_date = date_range
    plot = plot_stock_data(
        stock_symbol='THYAO.IS',
        start_date=start_date,
        end_date=end_date,
        frequency='1d'
    )
    return plot

app = pn.Column(
    datetime_range_picker,
    update_plot
).servable()

if __name__ == "__main__":
    app.show()
The code snippet provided initializes a Python application for financial data analysis with interactive features. It begins by creating a DatetimeRangePicker widget using the panel library, allowing users to select a specific date and time range. The default date range is set from 2023/01/01 to 2023/09/06.
The update_plot function is defined with a dependency on the value parameter of the datetime_range_picker widget, denoted by the @pn.depends decorator. This means that whenever the selected date range changes, the function automatically triggers. Inside update_plot, the start and end dates are extracted from the selected date range, and the plot_stock_data function is called to generate a stock data plot for the Turkish Airlines stock ('THYAO.IS') within the specified date range.
The app is created as a Panel column layout, consisting of the datetime_range_picker widget and the update_plot function. By invoking .servable(), the components are combined into an interactive dashboard.
The conditional statement if __name__ == "__main__": ensures that the app.show() method, which displays the Panel application, is only executed when the script is run directly as the main program, preventing it from running when imported as a module.

Allow users to choose a symbol.
import yfinance as yf
import pandas as pd
from datetime import datetime
import hvplot.pandas
import panel as pn

stock_symbols = ['THYAO.IS', 'GARAN.IS', 'MGROS.IS']

stock_select = pn.widgets.Select(
    name='Select Stock Symbol',
    options=stock_symbols,
    value=stock_symbols[0]
)

datetime_range_picker = pn.widgets.DatetimeRangePicker(
    name='Datetime Range Picker',
    value=(datetime(2023, 1, 1), datetime(2023, 9, 6))
)

def get_stock_data(stock_symbol, start_date, end_date, frequency='1d'):
    stock_data = yf.download(
        stock_symbol,
        start=start_date,
        end=end_date,
        interval=frequency,
        progress=False
    )
    return stock_data

def plot_stock_data(stock_symbol, start_date, end_date, frequency, column='Adj Close'):
    stock_data = get_stock_data(stock_symbol, start_date, end_date, frequency)
    stock_data = pd.DataFrame(stock_data)[[column]].rename(columns={column: stock_symbol})
    return stock_data.hvplot(
        title=f"{stock_symbol}",
        ylabel='',
        xlabel=''
    )

@pn.depends(datetime_range_picker.param.value, stock_select.param.value)
def update_plot(date_range, selected_stock):
    start_date, end_date = date_range
    plot = plot_stock_data(
        stock_symbol=selected_stock,
        start_date=start_date,
        end_date=end_date,
        frequency='1d'
    )
    return plot

app = pn.Column(
    stock_select,
    datetime_range_picker,
    update_plot
).servable()

if __name__ == "__main__":
    app.show()
Next, the script creates a dropdown menu widget using stock_select. This widget allows users to select one of the stock symbols from the predefined list and initializes with the first stock symbol as the default value.
The heart of the application lies in the update_plot function, which serves as a callback. It responds to changes in the selected stock symbol (selected_stock) or the chosen date range (date_range). Utilizing the @pn.depends decorator, the function specifies its dependencies on two widgets: datetime_range_picker and stock_select.
Within the function, it extracts the start and end dates from the date_range, and then calls the plot_stock_data function. This function fetches stock data for the selected stock symbol, date range, and a default frequency of '1d' (daily), ultimately returning a plot displaying the stock's adjusted closing prices. The function returns this plot, and it is updated in the Panel app whenever the user interacts with the widgets, ensuring a dynamic and responsive visualization.
The main Panel app, named app, is structured as a Column layout, featuring three components: stock_select for stock symbol selection, datetime_range_picker for date range selection, and update_plot for the interactive plot of the selected stock's price data. Together, these components provide users with a seamless and interactive experience, allowing them to explore stock price data for different companies within their chosen date range.

pn.extension is a function provided by Panel that allows us to set the template or theme for our web application.
import yfinance as yf
import pandas as pd
from datetime import datetime
import hvplot.pandas
import panel as pn

pn.extension(template='fast')

stock_symbols = ['THYAO.IS', 'GARAN.IS', 'MGROS.IS']

stock_select = pn.widgets.Select(
    name='Select Stock Symbol',
    options=stock_symbols,
    value=stock_symbols[0]
)

datetime_range_picker = pn.widgets.DatetimeRangePicker(
    name='Datetime Range Picker',
    value=(datetime(2023, 1, 1), datetime(2023, 9, 6))
)

def get_stock_data(stock_symbol, start_date, end_date, frequency='1d'):
    stock_data = yf.download(
        stock_symbol,
        start=start_date,
        end=end_date,
        interval=frequency,
        progress=False
    )
    return stock_data

def plot_stock_data(stock_symbol, start_date, end_date, frequency, column='Adj Close'):
    stock_data = get_stock_data(stock_symbol, start_date, end_date, frequency)
    stock_data = pd.DataFrame(stock_data)[[column]].rename(columns={column: stock_symbol})
    return stock_data.hvplot(
        title=f"{stock_symbol}",
        ylabel='',
        xlabel=''
    )

@pn.depends(datetime_range_picker.param.value, stock_select.param.value)
def update_plot(date_range, selected_stock):
    start_date, end_date = date_range
    plot = plot_stock_data(
        stock_symbol=selected_stock,
        start_date=start_date,
        end_date=end_date,
        frequency='1d'
    )
    return plot

app = pn.Column(
    stock_select,
    datetime_range_picker,
    update_plot
).servable()

if __name__ == "__main__":
    app.show()
By using pn.extension, we can easily enhance the visual appeal and functionality of our Panel-based web application.


We can also permanently switch our web application to dark mode.
import yfinance as yf
import pandas as pd
from datetime import datetime
import hvplot.pandas
import panel as pn

pn.config.theme = 'dark'
pn.extension(template='fast')

stock_symbols = ['THYAO.IS', 'GARAN.IS', 'MGROS.IS']

stock_select = pn.widgets.Select(
    name='Select Stock Symbol',
    options=stock_symbols,
    value=stock_symbols[0]
)

datetime_range_picker = pn.widgets.DatetimeRangePicker(
    name='Datetime Range Picker',
    value=(datetime(2023, 1, 1), datetime(2023, 9, 6))
)

def get_stock_data(stock_symbol, start_date, end_date, frequency='1d'):
    stock_data = yf.download(
        stock_symbol,
        start=start_date,
        end=end_date,
        interval=frequency,
        progress=False
    )
    return stock_data

def plot_stock_data(stock_symbol, start_date, end_date, frequency, column='Adj Close'):
    stock_data = get_stock_data(stock_symbol, start_date, end_date, frequency)
    stock_data = pd.DataFrame(stock_data)[[column]].rename(columns={column: stock_symbol})
    return stock_data.hvplot(
        title=f"{stock_symbol}",
        ylabel='',
        xlabel=''
    )

@pn.depends(datetime_range_picker.param.value, stock_select.param.value)
def update_plot(date_range, selected_stock):
    start_date, end_date = date_range
    plot = plot_stock_data(
        stock_symbol=selected_stock,
        start_date=start_date,
        end_date=end_date,
        frequency='1d'
    )
    return plot

app = pn.Column(
    stock_select,
    datetime_range_picker,
    update_plot
).servable()

if __name__ == "__main__":
    app.show()
The statement pn.config.theme = 'dark' is a configuration setting used within the Panel framework in software development. When this setting is applied, it instructs the framework to adopt a dark theme or appearance. In practical terms, this means that the user interface (UI) of the application or website built using the Panel framework will feature dark colors and design elements instead of a light or bright aesthetic. This dark theme is particularly useful in low-light environments where a bright UI might be distracting or uncomfortable, or for users who simply prefer a darker visual style for their applications or websites.

We can arrange the widgets and graphics side by side as follows.
import yfinance as yf
import pandas as pd
from datetime import datetime
import hvplot.pandas
import panel as pn

pn.config.theme = 'dark'
pn.extension(template='fast')

stock_symbols = ['THYAO.IS', 'GARAN.IS', 'MGROS.IS']

stock_select = pn.widgets.Select(
    name='Select Stock Symbol',
    options=stock_symbols,
    value=stock_symbols[0]
)

datetime_range_picker = pn.widgets.DatetimeRangePicker(
    name='Datetime Range Picker',
    value=(datetime(2023, 1, 1), datetime(2023, 9, 6))
)

def get_stock_data(stock_symbol, start_date, end_date, frequency='1d'):
    stock_data = yf.download(
        stock_symbol,
        start=start_date,
        end=end_date,
        interval=frequency,
        progress=False
    )
    return stock_data

def plot_stock_data(stock_symbol, start_date, end_date, frequency, column='Adj Close'):
    stock_data = get_stock_data(stock_symbol, start_date, end_date, frequency)
    stock_data = pd.DataFrame(stock_data)[[column]].rename(columns={column: stock_symbol})
    return stock_data.hvplot(
        title=f"{stock_symbol}",
        ylabel='',
        xlabel=''
    )

@pn.depends(datetime_range_picker.param.value, stock_select.param.value)
def update_plot(date_range, selected_stock):
    start_date, end_date = date_range
    plot = plot_stock_data(
        stock_symbol=selected_stock,
        start_date=start_date,
        end_date=end_date,
        frequency='1d'
    )
    return plot

app_layout = pn.Row(
    pn.Column(
        stock_select,
        datetime_range_picker,
    ),
    update_plot
)

app = app_layout.servable()

if __name__ == "__main__":
    app.show()
In the above code snippet, the application layout is organized into two key sections. The first section is the "User Input Section," encapsulated within the pn.Column nested within a pn.Row. Within this column, there are two widgets: stock_select and datetime_range_picker. These widgets likely enable users to select specific stocks or data series and specify date or time ranges, respectively. The second section, denoted as update_plot, is responsible for rendering and dynamically updating data visualizations based on user interactions with the input widgets. Finally, the app_layout.servable() method call creates the actual web application, preparing it for deployment and serving to end-users.

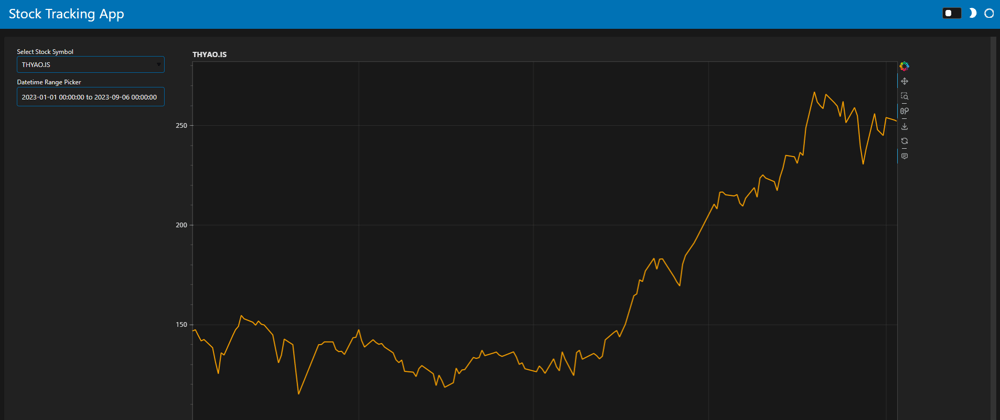
Let's finish our web application by increasing the height and width of the graphic and making some minor design adjustments to it.
import yfinance as yf
import pandas as pd
from datetime import datetime
import hvplot.pandas
import panel as pn

pn.config.theme = 'dark'
pn.extension(template='fast')

stock_symbols = ['THYAO.IS', 'GARAN.IS', 'MGROS.IS']

stock_select = pn.widgets.Select(
    name='Select Stock Symbol',
    options=stock_symbols,
    value=stock_symbols[0]
)

datetime_range_picker = pn.widgets.DatetimeRangePicker(
    name='Datetime Range Picker',
    value=(datetime(2023, 1, 1), datetime(2023, 9, 6))
)

def get_stock_data(stock_symbol, start_date, end_date, frequency='1d'):
    stock_data = yf.download(
        stock_symbol,
        start=start_date,
        end=end_date,
        interval=frequency,
        progress=False
    )
    return stock_data

def plot_stock_data(stock_symbol, start_date, end_date, frequency, column='Adj Close'):
    stock_data = get_stock_data(stock_symbol, start_date, end_date, frequency)
    stock_data = pd.DataFrame(stock_data)[[column]].rename(columns={column: stock_symbol})
    return stock_data.hvplot(
        title=f"{stock_symbol}",
        ylabel='',
        xlabel='',
        width=1500,
        height=800,
        line_color='orange',
        grid=True
    )

@pn.depends(datetime_range_picker.param.value, stock_select.param.value)
def update_plot(date_range, selected_stock):
    start_date, end_date = date_range
    plot = plot_stock_data(
        stock_symbol=selected_stock,
        start_date=start_date,
        end_date=end_date,
        frequency='1d'
    )
    return plot

app_layout = pn.Row(
    pn.Column(
        stock_select,
        datetime_range_picker,
    ),
    update_plot,
    height=800
)

app = app_layout.servable()

if __name__ == "__main__":
    app.show()
We made the changes I mentioned above in the plot_stock_data function.

We can modify the title from 'Pane Application' to 'Stock Tracking App' in the upper left corner.

In conclusion, my journey into the world of the Panel framework has been an exciting one. I've not only written a blog post introducing this framework but also put it into action by creating a web application. My thoughts on Panel are overwhelmingly positive – it holds great promise for the future of web development.
Comparing it to Streamlit, another popular choice in this space, I find that Panel offers a closer alignment with the web development ecosystem. This doesn't mean I underestimate Streamlit; rather, it showcases the versatility and adaptability of Panel.
As I've taken my first steps into this framework, I'm thrilled by the possibilities it presents. Looking ahead, I have ambitious plans to develop and share professional-grade applications using Panel. The journey has just begun, and I can't wait to see where Panel takes me in the world of web development. Stay tuned for more exciting updates and discoveries as I continue to explore the potential of the Panel framework.
Rome wasn't built in a day.


Top comments (0)