One Timescale Cloud database service is now ingesting a trillion metrics per day and storing almost two petabytes of data, challenging all assumptions that Postgres can’t scale. 🔍 Jump to the full article
After launching our Insights feature in late 2023, our most ambitious dogfooding effort yet, where we scaled Postgres to give users in-depth performance analytics on their database queries, we’re back with an update. And good news: we'll be sharing these metrics quarterly.
The TL;DR? One Timescale Cloud database service is now ingesting a trillion metrics per day and storing almost two petabytes of data, challenging all assumptions that Postgres can’t scale.
This massive operation runs entirely on Timescale Cloud using the same features available to all our users. There is no special treatment, no hidden infrastructure: you, too, could run a Postgres database at this scale with the offerings on Timescale Cloud.
Insights Recap: Scaling Postgres for Query Monitoring
To understand the scale of the problem we’re trying to solve, let’s quickly recap the feature being powered here by Timescale. Insights provides Timescale Cloud users with comprehensive query analytics, capturing execution times, memory usage, I/O statistics, and TimescaleDB feature utilization.
This means we capture every query running in our Cloud, gather relevant statistics, and store them in a fully queryable Timescale instance. Initially collecting about a dozen metrics per query, we've since tripled that number to enhance user visibility. The data volume expands along three dimensions: growing customer base, increasing per-customer query loads, and an expanding metrics collection.
Yet, we continue to track this data in Timescale Cloud, on a Postgres-based database, accomplishing Timescale’s original goal of creating a faster, more scalable Postgres.
Just Give Me the TL;DR (a.k.a. the Big Numbers)
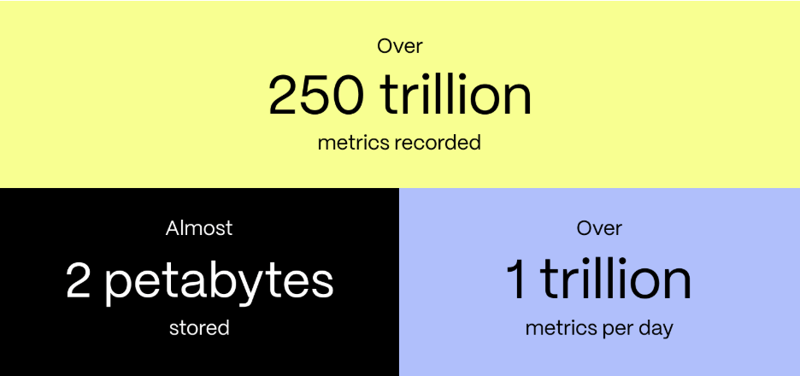
When we bragged talked about building Insights, the headline numbers were storing 350+ TBs of data and ingesting 10 billion records a day. Today, we’ll change the headline numbers to more than 250 trillion metrics recorded, nearly two petabytes stored, and one trillion daily metrics ingested.
Since launching the feature, we’ve refined how we measure Insights data, focusing on metrics rather than records—a record is a set of metrics for a query—with each query now capturing significantly more data points than in 2023.
That said, the numbers are impressive: we’ve moved into petabyte territory (the title gave this away), adding roughly one petabyte of data in the feature’s first year. Today, we stand at nearly two petabytes, with over 1.5 petabytes of data efficiently stored in Timescale’s tiered storage architecture, which is more easily accessible and query-able than ever.
Our daily ingest skyrocketed from 100 billion to one trillion metrics per day, totaling 250 trillion metrics collected. Despite this massive growth in data, queries, and more metrics per query, we still use the same size bowl for our dogfooding effort: a vanilla Timescale Cloud instance.
How We Scale Postgres and Stay Fast
Much of our architecture remains the same as described in our original post. We still ingest two main types of objects: a detailed “raw” record and a set of UDDSketches that represent a distribution of values for a given metric (“sketch” record).
A raw record contains the metrics for a single query invocation, along with some more detailed information, like a full breakdown of nodes used to execute the query. Conversely, the set of UDDSketches represents multiple query invocations. This allows us to store orders of magnitude more queries’ stats than if we stored only raw records.
Since launching the feature, we have generally sampled fewer raw records, now only collecting about 25 % of queries in this form. The node breakdown of execution can be useful in understanding how custom nodes we’ve created for TimescaleDB are performing across the fleet.
Adding new metrics to track has been straightforward—just new columns on our existing hypertables. Because we’ve essentially tripled the amount of metrics we collect, this does put more pressure on storage.
For raw records, as previously mentioned, we have just reduced the amount of sampling while continuing to aggressively tier data. For the sketch records, we’ve also begun using tiering for this table. This lets us keep our active dataset for the database around 12 TB (60 TB of pre-compressed data before using Timescale's row-columnar storage engine), with the rest (1.5+ PB) tiered.
To allow for aggressive tiering and quick responses to queries from our Insights page, we use continuous aggregates (our enhanced version of Postgres materialized views) heavily. UDDSketches “roll up” very nicely: you can combine a set of UDDSketches into a new UDDSketch representing the entire group. This allows us to go from the ingested UDDSketches into a hierarchical continuous aggregate tree with groupings at several levels (minutes, hours, days).
With a bit of planning, we’ve been able to have stats available at all the granularities we need to serve users without needing to go to the original hypertables. Inserts stay fast, queries stay fast, and we can tier without fear.
In the future, we may need to deploy read replicas to scale the solution, allowing us to separate the high write ingesting and aggregation workload from the high read workload that comes from customer usage. But as it stands today, we don’t need that; we have this billions-of-metrics-a-day pipeline running perfectly without scaling out.
Final Words
Since its inception, Insights has grown in both scale and impact, proving that Postgres—when engineered for scale—can handle immense workloads.
We’ve gone from tracking tens of billions of metrics daily to collecting a trillion of metrics while storing petabytes of data—all on a Timescale Cloud instance. The power of Timescale’s tiered storage, hypertables, and continuous aggregates has allowed us to not just scale but to stay fast and efficient.
If you’ve been thinking about taking your Timescale Cloud database to the next level, rest assured, we’re showing it’s entirely possible—our Cloud is your Cloud. And remember, you will never walk alone. Top-notch support is available for free for all Timescale Cloud customers, and our expert team is ready to guide you every step of the way, all the way to petabyte scale.
Start scaling—create a free Timescale account today.

Top comments (0)