Last weekend we had a chance to fine-tune the performance of a website that we started over a year ago.
It is a job board for Software Developers who are looking for work opportunities in Switzerland. Performance of SwissDevJobs.ch matters for 2 reasons::
Good user experience - which means both time to load (becoming interactive), and feeling of snappiness while using the website.
SEO - our traffic relies heavily on Google Search and, you probably know, that Google favors websites with good performance (they even introduced the speed report in Search Console).
If you search for "website performance basics" you will get many actionable points, like:
- Use a CDN (Content Delivery Network) for static assets with a reasonable cache time
- Optimize image size and format
- Use GZIP or Brotli compression
- Reduce the size of non-critical JS and CSS-code
We implemented most of those low-hanging fruits.
Additionally, as our main page is basically a filterable list (written in React) we introduced react-window to render only 10 list items at a time, instead of 250.
All of this helped us to improve the performance heavily but looking at the speed reports it felt like we can do better.
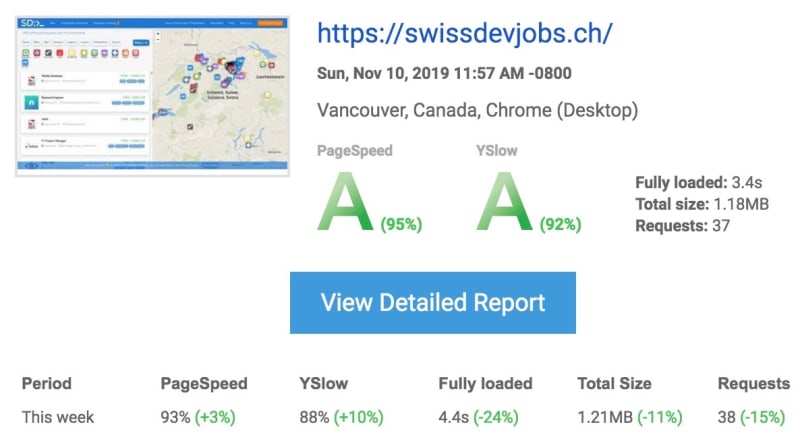
So we started digging into the more unusual ways in which we can make it faster and... we have been quite successful! Here is report from this week:
This report shows that the time of full load decreased by 24%!
What did we do to achieve it?
-
Use rel="preload" for the JSON data

This simple line in the index.html file indicates to the browser that it should fetch it before it's actually requested by an AJAX/fetch call from JavaScript.
When it comes to the point when the data is needed, it will be read from the browser cache instead of fetching again. It helped us to shave of ~0,5s of loading time
We wanted to implement this one earlier but there used to be some problems in the Chrome browser that caused double download. Now it seems to work.
-
Implement super simple cache on the server side
After implementing JSON preloading we found that downloading the job list is still the bottleneck (it takes around 0,8s to get the response from the server). Therefore, we decided to look into server-side cache. Therefore, we decided to look into server-side cache. First, we tried node-cache but, surprisingly, it did not improve the fetch time.
It is worth to mention that the /api/jobs endpoint is a simple getAll endpoint so there is little room for improvement.
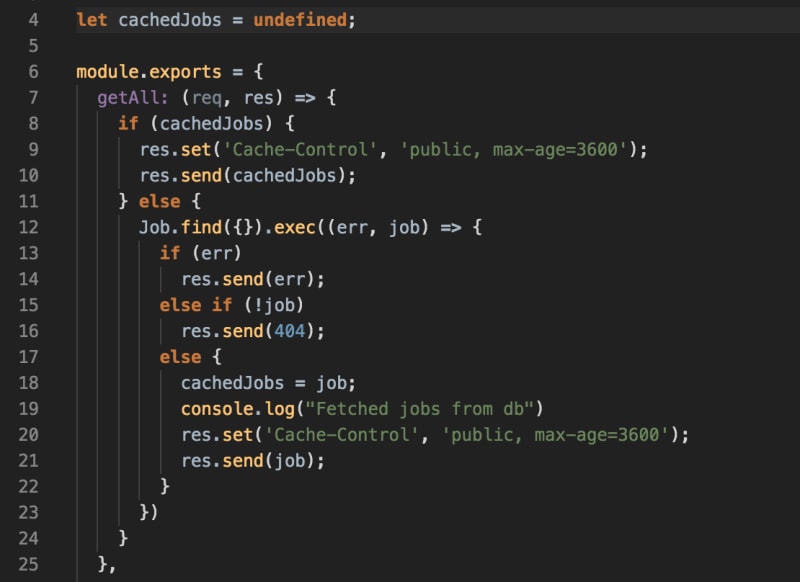
However, we decided to go deeper and built our own simple cache with... a single JS variable. It looks the following:
The only thing not visible here is the POST /jobs endpoint which deletes the cache (cachedJobs = undefined)
As simple as it is! Another 0,4s of load time off!
-
The last thing we looked at is the size of CSS and JS bundles that we load. We noticed that the "font-awesome" bundle weights over 70kb.
At the same time, we used only about 20% of the icons.
How did we approach it? We used icomoon.io to select the icons we used and created our own self-hosted lean icon package.
50kb saved!
Those 3 unusual changes helped us to speed up the website's loading time by 24%. Or, as some other reports show, by 43% (to 1,2s).
We are quite happy with these changes. However, we belive that we can do better than that!
If you have your own, unusual techniques that could help - we would be grateful for sharing them in the comments!


Top comments (20)
It looks like you could use some more webpack dynamic imports to modularize your output js/css further down - with http2 it should help a lot. Maybe even think about separating "shell" css from the details, and load details asynchronously. This could make a big difference in that big css.
If you are brave, play around with purgeCSS - Ive found it an amazing thing if it works :)
Also, doing metatag dns prefetch to your CDN domain could also speed things up - ssl handshakes can slow things up a bit.
It looks like your fonts have all the possible characters in them (19KB is pretty big) - you might want to check out this article - florianbrinkmann.com/en/glyphhange... - i found this recipe to work wonders on fonts i used in one project:
before: 19KB
after: 5KB
Additionally, instead of loading them in the main CSS, inlining them into
<style>in body, makes the request starts earlier, hence minimizing FOUT.Also, normally i wouldnt even mention this, but i think this is one of those rare cases where looking at the DOM depth and size could be a good investment if you look into performance issues.
Im a big fan of svg, but im not entirely sure that copying whole SVG tree every time its needed on the map is the way to go - if there is a big DOM tree with a depth, light png might be first easy step to make it a little bit shallower. But its very possible that with react and all that, its possible that your wiggle room will be small.
Hey Paweł,
Thank you for the detailed suggestions, appreciate a lot!
Addressing your points:
Fonts: ouh yeah, you can strip it down to characters you need - its very effective.
SVG - inlined svg is just a bunch of xml tags, so for 20 (even the same icons) your dom has 20x copy of that xml structure. I presume tiny png would be much flatter and i saw that you dont zoom/animate/manipulate icons on the map, so its less of a sin to migrate. Second option (probably better) would be to use svg symbols and use tag, to not duplicate the tree.
WebP for images is cool.
I just prefer to drop iconfonts if possible or replace with inlined
<svg>, depends how you design tho.We need to finally look into WebP :)
I have been using it, and is like 25~50% size of JPG depending what requirements are,
even more my web framework has builtin support for WebP.
Thanks for sharing, duely noted ;)
I'd recommand you add some OpenGraph metas to your website (pretty cool !), in order to improve sharing.
And maybe add a filter for remote working/freelancing, i'd be interested :p
Cheers !
Thanks for the suggestion.
For OpenGraph - already added some tags + Twitter card tags + JSON LD for Google.
The filter for remote work would be nice, unfortunately there is only a few companies (I mean like less than 10) in Switzerland that are fully open to remote work.
Thanks.
I'd still enjoy to see those companies haha
Maybe later
Can we rely on such conclusion?
Nice post!
Thanks!
Have you tried server-side rendering, this is what helps Angular get up to speed. That's all I can think of considering all great ideas in comments and your post
Which are your preferred tools to monitor performance over time?
Is the preload method above good for service worker and main js file?
I recommend you to check: developer.mozilla.org/en-US/docs/W...
Generally it should worker with the service worker, too.
Preload is mostly useful for resources that are loaded later in the chain.
In our case, the /api/jobs endpoint is called after the JS code is downloaded and processed, so it makes sense to start loading it earlier.
Chrome's Lighthouse audit plugin suggests:
Great site though!
Thanks for the suggestions.
Are you using the built-in Lighthouse performance audit in Chrome?
Asking, because On My Machine™ it does not show anything about minifying JS (should be done by default in CRA npm build)
As for images - do you mean jpgs or maybe some of the new formats like WebP?
And the last thing - CSS, do you know any straight forward solution here for Create React App?
that good to read