Originally written by Lidia Kurasińska
For your business to perform at an optimal level, you need to take a proactive approach to in-depth monitoring and analysis of your key asset: the product you’re offering.
Server crashes and unexpected downtime mean frustrated users and lost revenue. Therefore, being able to detect any issues in your IT infrastructure before they escalate and monitor failure patterns will go a long way toward making sure you deliver seamless performance to your end users.
But infrastructure monitoring is not only about minimizing disruption. By providing you with in-depth insights about your product, it will enable you to better understand its day-to-day performance and make data-driven, long-term decisions about its future.
Based on our experience of helping clients monitor their infrastructure 24/7, we wrote this post to help you understand the importance of having reliable monitoring tools and mechanisms in place.
In our collaboration with our partners, we’ve used mainly Amazon CloudWatch and OpsGenie, so we’ll focus on these two tools. However, many of their underlying principles can be replicated with other monitoring services available on the market.
What is infrastructure monitoring?
Infrastructure monitoring refers to the process of collecting and reviewing data about your infrastructure’s status and performance.
Some of the monitored metrics include:
- the load levels of, for instance, CPU or RAM;
- the status of services that run on the server (e.g. the application or the database);
- the number of errors that have occurred in certain services (e.g. the 5xx error code on the NGINX server).
The collected data can come from various sources: from the application itself to the computer that hosts it. Gathering this information is the basis of infrastructure monitoring, as it allows administrators to define the server’s status and configure the alerts that provide notifications on any unusual performance.
By gathering a wealth of data, infrastructure monitoring tools give administrators the necessary insight to protect the business and plan ahead.
What are the benefits of infrastructure monitoring?
Continuous infrastructure monitoring helps you achieve the desired product performance, maximize efficiency, and save resources by detecting problems before they escalate and impact your business.
Below are some of the many reasons why you should invest in a reliable monitoring tool.
1. Respond to incidents fast
If an incident happens, you should be the first one to know about it. Having a clear view of your infrastructure is crucial if you want to be able to detect and resolve any problems before they spread and potentially damage your relationship with your users.
Regardless of the nature of the issue you’re facing, being able to respond to it as soon as it appears will go a long way toward protecting your business.
2. Get a better understanding of your infrastructure
Monitoring your infrastructure continuously and proactively gives you a clear picture of how it performs on a daily basis, and allows you to monitor failure patterns and pick up on any warning signs early on.
For instance, if your application suddenly starts to perform below expectations, visualizing the monitoring data might give you valuable insight into what has caused the bottleneck.
3. Make informed, data-driven decisions
Having clear, data-driven insights into the health of your infrastructure isn’t crucial in just helping you understand its ongoing performance. Most importantly, it allows you to make informed decisions about your long-term IT infrastructure strategy and investment plans.
4. Save time and money
If you want to keep your infrastructure-related costs under control, you can’t afford to go without the use of monitoring tools. They offer an easy way to find out how your server plans correspond to your actual needs.
Whether you’ve been underutilizing your existing cloud service or are about to require a larger and more expensive package, analyzing your monitoring data will help you manage your budget.
5. Give yourself peace of mind
Monitoring your infrastructure 24/7 simply gives you peace of mind. If anything goes wrong, you will be notified the very same moment and can get down to fixing the problem straight away.
Analyzing the monitoring data can also provide you with insight on the kind of long-term trends you can expect in the future.
What are some of the tools used in infrastructure monitoring?
To get started with infrastructure monitoring, first you need to pick the right tool. Since different systems require different solutions, it’s worth taking a look around to make sure you choose the one with the most suitable features for your set of servers.
For the purpose of this article, we’ll broadly break them up into two categories: cloud-native and non-native.
1. Cloud-native solutions
If you use cloud services to host your infrastructure, sticking to your provider’s native solutions is usually the best option.
The native tools are a breeze to set up, since they come with your cloud account and are easy to maintain. You won’t need to worry about your tool-hosting server or install additional agents on the server for most basic metrics.
The most popular cloud services and their native monitoring tools are:
- AWS: Amazon CloudWatch
- Google Cloud Platform: Stackdriver Monitoring and Stackdriver Logging
- Azure: Azure Monitor
These tools usually provide us with some basic data at the hypervisor level (the tool responsible for server virtualization). However, it’s possible to push custom data using scripts or agents. AWS even offers one that monitors RAM and disk usage.
On top of monitoring, cloud services can also track API calls using CloudTrail. This can provide you with some insight on, for instance, the changes made to the infrastructure, the resources accessed by the users, and others.
2. Non-native solutions
Besides cloud-native solutions, you can always make use of non-native tools. They’re a good option when you need to monitor on-premise infrastructure.
Some non-native solutions require additional software (a client) to be installed on each server that needs to be monitored. The data is then sent by the agent to the server (the tool) which subsequently processes the information. Some of the most popular ones include:
- Prometheus + Alertmanager
- Grafana (as data visualizer and for triggering alerts)
- Nagios
- Zabbix
- Icinga/Icinga2
- Graphite
- Sensu
An overview of Amazon CloudWatch and OpsGenie
As you’ve seen above, there are plenty of infrastructure monitoring tools to choose from. However, for the purpose of giving you a general idea of how they work, we will focus on the examples of Amazon CloudWatch and OpsGenie.
We used these tools for one of our clients who had chosen AWS as a cloud provider for their infrastructure. Although we can’t identify who the client was for this particular project, you can always explore our portfolio for other client stories.
1. Amazon CloudWatch
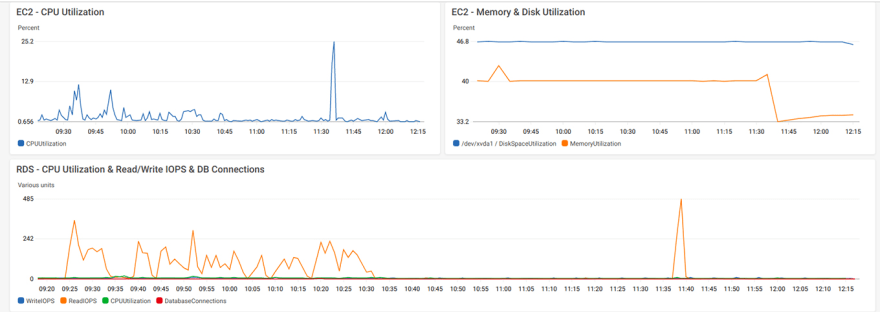
Amazon CloudWatch is a native tool to monitor AWS resources, such as EC2, RDS, SQS, ElastiCache, SES, and others. It allows you to create dashboards to visualize metrics, which can include the amount of RAM used by the EC2 instance or the number of connections established to the RDS.
The Dashboard feature is very useful, as it can give you instant insight into the status of your infrastructure. It auto-refreshes, so you can display it on a TV screen in the developers’ room.
 A sample dashboard in Cloudwatch
However, the key functionality of CloudWatch is Alarms. It allows you to set up alarms for the metrics you want to monitor.
Although many of them will indeed have to be client-specific, you should also consider using basic AWS metrics such as the CPU and RAM usage of EC2 instances, Read/Write IOPS for DB instances, and the number of bounced emails from SES.
Usually, you need to adjust the alarms after the initial setup to avoid false positives.
An alarm in CloudWatch can have one of these three statuses:
- OK
- INSUFFICIENT_DATA
- ERROR
 Alarms in Amazon Cloudwatch
Whenever an alarm changes its status, you need to identify what action to take. This leads us to the next tool we want to give you a general overview of: OpsGenie.
2. OpsGenie
OpsGenie is an incident management service that integrates with your monitoring tool to provide you with around-the-clock notifications on the status of your infrastructure. It’s triggered by SNS—the AWS messaging service that can send notifications via email, webhook, or text message.
A tool like OpsGenie plays a crucial role when you want to stay ahead of disruptions and resolve any issues before they escalate. It will help your team build on-call schedules and will keep everyone informed on who’s accountable for any alerts that emerge.
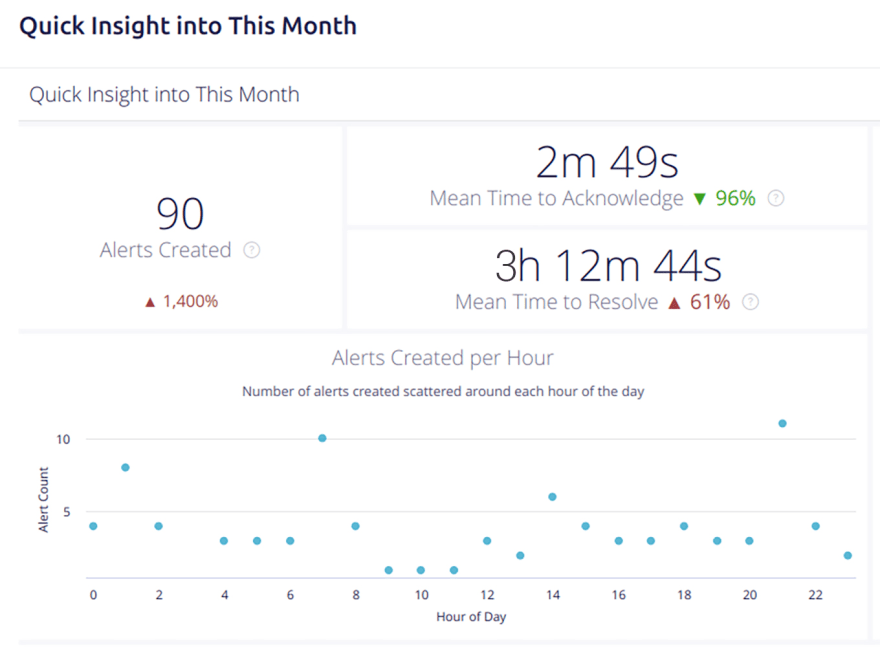
The platform’s reporting and analytics tools will also help you get to the bottom of the alerts and analyze the team’s workload and performance.
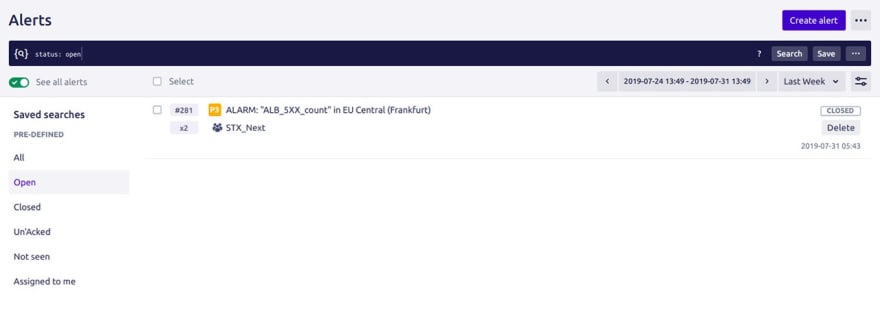
One OpsGenie instance can work for multiple teams, and each team member can look up the schedule, revise it, or just go through past alarms.
The tool is available as a native app for both Android and iOS. We use it a great deal, because it supports push and email notifications as well as mobile phone calls.
The app allows you to manage the way you want to be notified about any alerts. For instance, we’ve customized it to receive the first notification as a push notification. If the notification isn’t acknowledged within three minutes, the app will make a phone call to the on-duty engineer. In case the engineer doesn’t act upon it, OpsGenie will escalate the process and alert other team members.


Top comments (0)