So now we have the Prometheus up and running and we even send some metrics there thanks to Grafana cloud agent. How to view these metrics in some more convenient way?
Yes, the answer is Grafana, the best in class tool for the job. And since we have a Kubernetes cluster - we're gonna run it inside this cluster. Grafana is not really resource-intensive beast and this will be also cheaper than managed services like Amazon Managed Grafana.
Persistence
Grafana needs some persistent store for users, dashboards and other stuff. We can use Persistent Volume Claim but again - we want to keep our cluster lean. So our next choice is RDS in its smallest configuration.
data "aws_caller_identity" "current" {}
data "aws_region" "current" {}

resource "random_password" "password" {
  length  = 32
  special = false
}

resource "aws_security_group" "this" {
  name   = "grafana_${var.environment}"
  vpc_id = var.vpc_id
}

resource "aws_security_group_rule" "egress_all" {
  type     = "egress"
  to_port  = 0
  protocol = "-1"
  cidr_blocks = [
    "0.0.0.0/0",
  ]
  from_port         = 0
  security_group_id = aws_security_group.this.id
}

resource "aws_security_group_rule" "ingress_posgres" {
  type                     = "ingress"
  to_port                  = 5432
  protocol                 = "tcp"
  source_security_group_id = var.source_security_group_id
  from_port                = 5432
  security_group_id        = aws_security_group.this.id
}

resource "aws_db_subnet_group" "this" {
  name       = "grafana-${var.environment}"
  subnet_ids = var.subnet_ids
}

resource "aws_db_instance" "this" {
  availability_zone    = var.availability_zone
  allocated_storage    = 10
  engine               = "postgres"
  engine_version       = var.postgres_engine_version
  instance_class       = var.postgres_instance_class
  identifier           = "grafana-${var.environment}"
  db_name              = "grafana"
  username             = "root"
  password             = random_password.password.result
  skip_final_snapshot  = true
  db_subnet_group_name = aws_db_subnet_group.this.name
  vpc_security_group_ids = [
    aws_security_group.this.id,
  ]
}
You can see here some similarities with the EC2 instance from the first chapter. Once again we've created a separate Security Group with the only ingress rule allowing the communication only from the Kubernetes cluster.
Single sign-on
Grafana supports variety of single sign-on options, in this writeup we're gonna use Gitlab but you can use Github, some generic OIDC solution or the internal database.
Installation of Grafana
Let's prepare values files for the Grafana Helm chart.
replicas: 1

grafana.ini:
  server:
    domain: grafana.<your domain name>
    root_url: https://grafana.<your domain name>/
    enforce_domain: true
    protocol: http
  auth.anonymous:
    enabled: false
  database:
    type: postgres
    host: <RDS endpoint from the previous steps>
    user: root
    password: <RDS password from the previous steps>
    name: grafana
    ssl_mode: require
    max_open_conn: 25
    max_idle_conn: 25
  unified_alerting:
    enabled: true
  alerting:
    enabled: false
  smtp:
    enabled: false
  users:
    auto_assign_org: true
  auth.gitlab:
    enabled: true
    allow_sign_up: true
    client_id: <id from the Gitlab app>
    client_secret: <secret from the Gitlab app>
    scopes: read_api
    auth_url: https://gitlab.com/oauth/authorize
    token_url: https://gitlab.com/oauth/token
    api_url: https://gitlab.com/api/v4
    allowed_groups: <your Gitlab group>

ingress:
  enabled: false
Note the ingress.enabled property. In this particular infrastructure we're using Traefik so we don't need to create Ingress object. Instead I've created a simple IngressRoute resource:
apiVersion: traefik.containo.us/v1alpha1
kind: IngressRoute
metadata:
  name: grafana
  namespace: grafana
spec:
  entryPoints:
    - websecure
  routes:
  - match: Host(`grafana.<your domain name>`) && PathPrefix(`/`)
    kind: Rule
    priority: 1
    services:
    - name: grafana
      port: 80
      scheme: http
If you're using Nginx ingress controller, then you just need to re-enable it in the values:
ingress:
  enabled: true
  ingressClassName: nginx
  annotations: {}
    kubernetes.io/ingress.class: nginx
  labels: {}
  path: /
  pathType: Prefix
  hosts:
    - grafana.<your domain name>
You know the drill I guess. Let's install this with simple Helm command:
helm repo add grafana https://grafana.github.io/helm-charts
helm repo update
helm upgrade --install grafana grafana/grafana -n grafana -f values.yaml --version 6.21.4
And that's it. For the administration tasks we just need one more thing - admin password:
kubectl get secret --namespace grafana grafana -o jsonpath="{.data.admin-password}" | base64 --decode ; echo
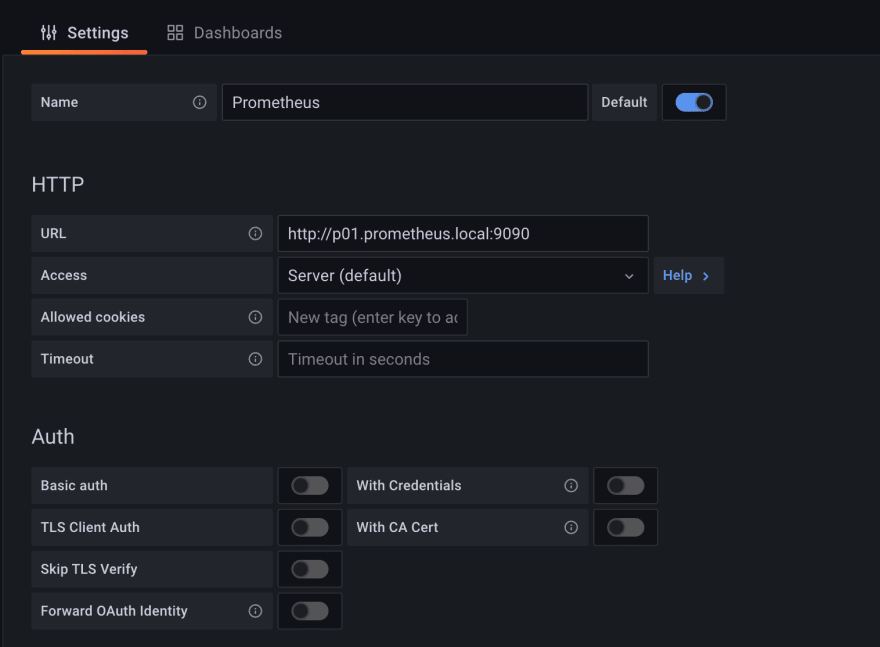
Adding Prometheus data source to Grafana
This is perhaps the most straightforward task, just log-in, open datasources section in settings and fill in the domain name we've defined in the first chapter.
Wrap
And that's it! In the next chapter I'll show you how to forward alertmanager notifications to Telegram group. Stay tuned!

Top comments (0)