
We have a lot of AWS Lambda functions in the project, and developers want to be able to send metrics to our Prometheus to add their own alerts and graphs in Grafana.
For this, the functions use the Prometheus library, which allows these metrics to be created (see Prometheus: Building a Custom Prometheus Exporter in Python). But we cannot normally get this data from Prometheus, because the functions can live for several seconds, and Prometheus uses PULL -model, that is, he himself goes to exporters and extracts data from there.
What we can do in the case of AWS Lambda is to add Prometheus Pushgateway, which will have an external endpoint to which functions will send their metrics. Then, Prometheus will take this data from Pushgateway, which acts as a “proxy role”.
The general scheme of how Prometheus works and the role of Pushgateway is well represented in this diagram:

So today we will launch Prometheus Pushgateway in Kubernetes using its Helm chart and will install this chart using Terraform.
Pushgateway Helm chart
First, let’s see what we have in the values of the Pushgateway chart.
In fact, for now, we can be interested in only two parameters — the Ingress and ServiceMonitor.
Let’s write our values, deploy the environment to Dev for the test, and then will add it to Terraform, through which Pushgateway will be deployed to all our monitoring environments:
ingress:
  enabled: true
  className: alb
  path: /
  pathType: Prefix
  annotations:
    alb.ingress.kubernetes.io/scheme: internal
    alb.ingress.kubernetes.io/certificate-arn: arn:aws:acm:us-west-2:638***021:certificate/e97f17e9-33f9-46e7-9b2b-d50de8a72219
    alb.ingress.kubernetes.io/target-type: ip
  hosts:
    - test-pushgateway.monitoring.dev.example.com

serviceMonitor:
  enabled: true
  namespace: monitoring
  additionalLabels:
    release: prometheus
Here we describe the creation of Kubernetes Ingress, to which we will connect an SSL certificate from Amazon Certificate Manager to port 443 of the corresponding AWS Application Load Balancer. In the hosts field, specify a hostname that will be created in AWS Route53 using ExternalDNS.
And at the end, we are adding a ServiceMonitor with the label release: prometheus so that Prometheus from the Kube Prometheus Stack can see it.
Add the Prometheus repository:
$ helm repo add prometheus-community https://prometheus-community.github.io/helm-charts
$ helm repo update
And install Pushgateway to the namespace monitoring:
$ helm -n monitoring upgrade — install prometheus-pushgateway-test prometheus-community/prometheus-pushgateway -f pushgateway-values-dev.yaml
…
NOTES:
1. Get the application URL by running these commands:
http://test-pushgateway.monitoring.example.com/
Check its Pod and Ingress:
$ kubectl get pod,ingress — namespace monitoring -l app.kubernetes.io/instance=prometheus-pushgateway-test
NAME READY STATUS RESTARTS AGE
pod/prometheus-pushgateway-test-6b5dfbdd7f-chzkf 1/1 Running 0 53s
NAME CLASS HOSTS ADDRESS PORTS AGEingress.networking.k8s.io/prometheus-pushgateway-test alb test-pushgateway.monitoring.dev.example.com internal-k8s-monitori-promethe- ***-***.us-west-2.elb.amazonaws.com 80 54s
Pushgateway has its own web interface — open access to its Pod on port 9091:
$ kubectl -n monitoring port-forward pod/prometheus-pushgateway-test-6b5dfbdd7f-chzkf 9091
Forwarding from 127.0.0.1:9091 -> 9091
Forwarding from [::1]:9091 -> 9091
Go to http://localhost:9091 in the browser :

Next, let’s check whether Prometheus itself sees this Pushgateway — open port 9090 to the Prometheus Pod:
$ kubectl -n monitoring port-forward prometheus-prometheus-kube-prometheus-prometheus-0 9090
Forwarding from 127.0.0.1:9090 -> 9090
Forwarding from [::1]:9090 -> 9090
Go to Status > Targets and look for the Pushgateway target:

And let’s check if the metrics from Pushgateway will get to Prometheus.
Since our Ingress/ALB is of type internal, i.e., not accessible from the Internet, let's run a Kubernetes Pod with Ubuntu in the Kubernetes cluster:
$ kubectl run pod --rm -i --tty --image ubuntu -- bash
If you don’t see a command prompt, try pressing enter.
root@pod:/#
Install curl:
root@pod:/# apt update && apt -y install curl
But using the documentation, send a request, just do not specify the port here, because it is 443, SSL:
root@pod:/# echo “some_metric 3.14” | curl — data-binary @- https://test-pushgateway.monitoring.dev.exmaple.com/metrics/job/some_job
Check in the Pushgateway:

And in the Prometheus:
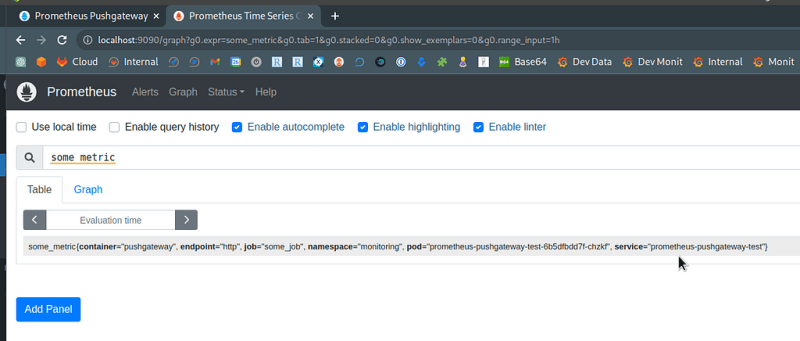
Good, we’ve got our metric.
Pushgateway authentication
Since our Pushgateway works on the internal ALB, I haven’t done authentication yet, because it’s still in the process of testing, and it’s not yet known how it will work for developers.
But in values, there is a block with an example of starting a container with openshift/oauth-proxy, and in the Using OpenShift OAuth Proxy to secure your Applications on OpenShift, there is an example of its use, may be will try it later.
Terraform and Helm for Pushgateway
In our project, most of the resources in Kubernetes are deployed using Terraform and its helm\_release resource.
We have many AWS accounts, and each one will have its own certificate ARN, so let’s get it using the Terraform Data Source (or you can create your own certificate using aws_acm_certificate):
data "aws_acm_certificate" "wildcard" {
  domain = "*.${var.root_domain}"
}
The root_domain variable is passed from the main module and looks like monitoring.dev.example.com.
Create a template for our values pushgateway-values.tpl.yaml:
ingress:
  enabled: true
  className: alb
  path: /
  pathType: Prefix
  annotations:
    alb.ingress.kubernetes.io/scheme: internal
    alb.ingress.kubernetes.io/certificate-arn: ${acmWildcardArn}
    alb.ingress.kubernetes.io/target-type: ip
  hosts:
    - ${pushgatewayUrl}

serviceMonitor:
  enabled: true
  namespace: monitoring
  additionalLabels:
    release: prometheus
And add helm_release, where in the values[] we set the template file and a couple of variables - the ARN of the certificate received with the help of data.aws_acm_certificate, and the domain for Ingress hosts:
resource "helm_release" "pushgateway" {
  name = "prometheus-pushgateway"

  namespace = kubernetes_namespace.monitoring.id

  repository = "https://prometheus-community.github.io/helm-charts"
  chart = "prometheus-pushgateway"
  version = "2.1.3"
  max_history = 10

  values = [
    templatefile("${path.module}/configs/prometheus/pushgateway-values.tpl.yaml", {
      acmWildcardArn : data.aws_acm_certificate.wildcard.arn,
      pushgatewayUrl : "pushgateway.${var.root_domain}"
    })
  ]
}
Deploy it:
$ terraform apply
…
module.monitoring.helm_release.pushgateway: Creating…
module.monitoring.helm_release.pushgateway: Still creating… [10s elapsed]
module.monitoring.helm_release.pushgateway: Still creating… [20s elapsed]
module.monitoring.helm_release.pushgateway: Still creating… [30s elapsed]
module.monitoring.helm_release.pushgateway: Creation complete after 32s [id=prometheus-pushgateway]
…
Apply complete! Resources: 1 added, 1 changed, 0 destroyed.
Check corresponding Ingress and Pod:
$ kubectl -n monitoring get ingress,pod -l app.kubernetes.io/instance=prometheus-pushgateway
NAME CLASS HOSTS ADDRESS PORTS AGE
ingress.networking.k8s.io/prometheus-pushgateway alb pushgateway.monitoring.dev.example.com internal-k8s-monitori-promethe- ***-***.us-west-2.elb.amazonaws.com 80 10m
NAME READY STATUS RESTARTS AGE
pod/prometheus-pushgateway-55b9f5ffd6-sm9ck 1/1 Running 0 10m
Done.
Originally published at RTFM: Linux, DevOps, and system administration.

Top comments (0)