
Prometheus has many ready-to-use exporters, but sometimes you may need to collect your own metrics.
For this, Prometheus provides client libraries that we can use to generate metrics with the necessary labels.
Such an exporter can be included directly in the code of your application, or it can be run as a separate service that will poll one of your services and receive data from it, which will then be converted into the Prometheus format and sent to the Prometheus server.
Prometheus Metrics
The general scheme of the Prometheus server and its exporters in Kubernetes looks like this:

Here we have:
- Prometheus Server, which in our case is deployed using the Kube Prometheus Stack and Prometheus Operator
- using ServiceMonitor via Operator, we create a Scrape Job that has one or more Targets, i.e. services that Prometheus will poll for metrics that it stores in its Time Series Database
- for the URLs specified in the Target, Prometheus calls the Prometheus Exporter endpoint
- and Prometheus Exporter collects metrics from your application, which it then sends to Prometheus
Prometheus metric types
When we plan to write our own exporter, we need to know what types of metrics we can use in it. Main types:
-
Counter: can only increase its value, for example, to count the number of HTTP requests -
Enum: has predefined values, used, for example, to monitor the number of pods in the Running or Failed status -
Histograms: stores a value over a period of time, and can be used to, for example, get the response time of a web server over a period of time -rate(metric_name{}[5m]) -
Gauges: can take any value, can be used for, for example, storing CPU load values -
Info: key-value storage, for example for Build information, Version information, or metadata
Each type has its own methods, so it is worth looking at the documentation. See Prometheus Python Client, or in the documentation of the library itself:
>>> import prometheus_client
>>> help(prometheus_client.Enum)
Python Custom Prometheus Exporter
Python HTTPServer Exporter з Counter
To begin with, let’s see how it works in general — let’s write a script in Python, in which there will be a regular HTTP server on port 8080, and on port 9000 — an exporter that will collect statistics on requests with response codes and create a metric http_requests with two labels - in one we will store a response code, and in the other - the name of the host from which the metric was obtained.
Install the library:
$ pip install prometheus_client
Write the script:
#!/usr/bin/env python

import os
import re
import platform
from time import sleep

from http.server import BaseHTTPRequestHandler, HTTPServer

from prometheus_client import start_http_server, Counter, REGISTRY

class HTTPRequestHandler(BaseHTTPRequestHandler):

    def do_GET(self):
        if self.path == '/':
            self.send_response(200)
            self.send_header('Content-type','text/html')
            self.end_headers()
            self.wfile.write(bytes("<b> Hello World !</b>", "utf-8"))
            request_counter.labels(status_code='200', instance=platform.node()).inc()
        else:
            self.send_error(404)
            request_counter.labels(status_code='404', instance=platform.node()).inc()


if __name__ == ' __main__':

    start_http_server(9000)
    request_counter = Counter('http_requests', 'HTTP request', ["status_code", "instance"])

    webServer = HTTPServer(("localhost", 8080), HTTPRequestHandler).serve_forever()
    print("Server started")
Here we:
-
start_http_server()- start the HTTP server of the exporter itself on port 9000 -
request_counter- create a metric with the name http_requests, type Counter, and add two labels to it – status_codeandinstance -
webServer- run a regular HTTP server on Python on port 8080
Next, when we make an HTTP request to localhost:8080, it will go to the do_GET() method, in which the URI of the request will be checked. If we go to the / - then we will get the code 200 if any other - then 404.
And there we are doing an update of the value of the metric http_requests - add the response code and the hostname, and call the method Counter.inc() that will increment the value of the metric by one. Thus, each request that will be processed by the web server webServer will add +1 to our metric, and depending on the response code, we will receive this metric with two different labels - 200 and 404.
Check how it’s working, run the script itself:
$ ./py_http_exporter.py
Make several requests with different URIs:
$ curl -I -X GET localhost:8080/
HTTP/1.0 200 OK

$ curl -I -X GET localhost:8080/
HTTP/1.0 200 OK

$ curl -I -X GET localhost:8080/
HTTP/1.0 200 OK

$ curl -I -X GET localhost:8080/blablabla
HTTP/1.0 404 Not Found

$ curl -I -X GET localhost:8080/blablabla
HTTP/1.0 404 Not Found

$ curl -I -X GET localhost:8080/blablabla
HTTP/1.0 404 Not Found
Now let’s check what we have on the exporter endpoint:
$ curl -X GET localhost:9000
…
HELP http_requests_total HTTP request
TYPE http_requests_total counter
http_requests_total{instance=”setevoy-wrk-laptop”,status_code=”200"} 3.0
http_requests_total{instance=”setevoy-wrk-laptop”,status_code=”404"} 3.0
Exellent, we have three requests with code 200 and three with code 404.
Jenkins Jobs Exporter with Gauage
Or another option is when the exporter will refer to some external resource, receive values, and enter them into the metric.
For example, we can refer to some API and get data from it, in this example it will be Jenkins:
#!/usr/bin/env python

import time
import random
from prometheus_client import start_http_server, Gauge
from api4jenkins import Jenkins

jenkins_client = Jenkins('http://localhost:8080/', auth=('admin', 'admin'))

jenkins_jobs_counter = Gauge('jenkins_jobs_count', "Number of Jenkins jobs")

def get_metrics():
   jenkins_jobs_counter.set(len(list(jenkins_client.iter_jobs())))

if __name__ == ' __main__':
    start_http_server(9000)
    while True:
        get_metrics()
        time.sleep(15)
Here we use the library api4jenkins to create an object jenkins_client that connects to the Jenkins instance and receives the number of its jobs. Then, in the function, get_metrics() we count the number of objects from jenkins_client.iter_jobs(), and enter them into the metric jenkins_jobs_counter.
Launch in Docker:
$ docker run -p 8080:8080 jenkins:2.60.3
Create a test job:

As a result, we get the following result:
$ curl localhost:9000
…
HELP jenkins_jobs_count Number of Jenkins jobs
TYPE jenkins_jobs_count gauge
jenkins_jobs_count 1.0
Prometheus Exporter and Kubernetes
And let’s test some more real examples.
We have an API service that uses a PostgreSQL database. To check the connection, the developers have created an endpoint that we can contact to get the current status — whether or not there is a connection to the database server.
Currently, we use Blackbox Exporter to monitor it, but later we want to expand the capabilities a bit, so we will try to create an exporter that for now will simply check the response code of this endpoint.
Exporter with Enum and Histogram
#!/usr/bin/env python

import os
import requests
import time
from prometheus_client import start_http_server, Enum, Histogram

hitl_psql_health_status = Enum("hitl_psql_health_status", "PSQL connection health", states=["healthy", "unhealthy"])
hitl_psql_health_request_time = Histogram('hitl_psql_health_request_time', 'PSQL connection response time (seconds)')

def get_metrics():

    with hitl_psql_health_request_time.time():
        resp = requests.get(url=os.environ['HITL_URL'])

    print(resp.status_code)

    if not (resp.status_code == 200):
        hitl_psql_health_status.state("unhealthy")

if __name__ == ' __main__':
    start_http_server(9000)
    while True:
        get_metrics()
        time.sleep(1)
Set the environment variable from the URL:
$ export HITL_URL=https://hitl.qa.api.example.com/api/v1/postgres/health-check
Run the script:
$ ./py_hitl_exporter.py
500
500
500
Hmmm… Nice — the health-check endpoint is down. 🙂 Let the developers check it on Monday, the 500 response code is also suitable for us.
Docker image
Next, we need to build a Docker image. First, we will create it requirements.txt with dependencies:
requests
prometheus_client
Now, its Dockerfile:
FROM python:3.8

COPY py_hitl_exporter.py /app/py_hitl_exporter.py
COPY requirements.txt /app/requirements.txt
WORKDIR /app
RUN pip install -r requirements.txt
ENV HITL_URL $HITL_URL
CMD ["python3", "/app/py_hitl_exporter.py"]
Build it:
$ docker build -t setevoy/test-exporter .
Run locally to check:
$ docker run -p 9000:9000 -e HITL_URL=https://hitl.qa.api.example.com/api/v1/postgres/health-check setevoy/test-exporter
Check the metrics:
$ curl localhost:9000
…
HELP hitl_psql_health_status PSQL connection health
TYPE hitl_psql_health_status gauge
hitl_psql_health_status{hitl_psql_health_status=”healthy”} 0.0
hitl_psql_health_status{hitl_psql_health_status=”unhealthy”} 1.0
HELP hitl_psql_health_request_time PSQL connection response time (seconds)
TYPE hitl_psql_health_request_time histogram
hitl_psql_health_request_time_bucket{le=”0.005"} 0.0
hitl_psql_health_request_time_bucket{le=”0.01"} 0.0
hitl_psql_health_request_time_bucket{le=”0.025"} 0.0
hitl_psql_health_request_time_bucket{le=”0.05"} 0.0
hitl_psql_health_request_time_bucket{le=”0.075"} 0.0
hitl_psql_health_request_time_bucket{le=”0.1"} 0.0
hitl_psql_health_request_time_bucket{le=”0.25"} 0.0
hitl_psql_health_request_time_bucket{le=”0.5"} 0.0
hitl_psql_health_request_time_bucket{le=”0.75"} 0.0
hitl_psql_health_request_time_bucket{le=”1.0"} 0.0
hitl_psql_health_request_time_bucket{le=”2.5"} 0.0
hitl_psql_health_request_time_bucket{le=”5.0"} 0.0
hitl_psql_health_request_time_bucket{le=”7.5"} 0.0
hitl_psql_health_request_time_bucket{le=”10.0"} 0.0
hitl_psql_health_request_time_bucket{le=”+Inf”} 9.0
hitl_psql_health_request_time_count 9.0
hitl_psql_health_request_time_sum 96.56228125099824
Good!
Let’s push it to Docker Hub:
$ docker login
$ docker push setevoy/test-exporter
Kubernetes Pod, Service, and ServiceMonitor for Prometheus
Next, we need to run this image in Kubernetes and create a ServiceMonitor for Prometheus, which is already running there.
Let’s create a manifest with Pod, Service, and ServiceMonitor:
apiVersion: v1
kind: Pod
metadata:
  name: hitl-exporter-pod
  labels:
    app: hitl-exporter
spec:
  containers:
    - name: hitl-exporter-container
      image: setevoy/test-exporter
      env:
      - name: HITL_URL
        value: [https://hitl.qa.api.example.com/api/v1/postgres/health-check](https://hitl.qa.api.example.com/api/v1/postgres/health-check)
      ports:
        - name: metrics
          containerPort: 9000
          protocol: TCP
---
apiVersion: v1
kind: Service
metadata:
  name: hitl-exporter-service
  labels:
    app: hitl-exporter
spec:
  selector:
    app: hitl-exporter
  ports:
    - name: metrics
      port: 9000
      targetPort: metrics
---
apiVersion: monitoring.coreos.com/v1
kind: ServiceMonitor
metadata:
  labels:
    release: kps
    app: hitl-exporter
  name: hitl-exporter-monitor
spec:
  endpoints:
    - port: metrics
      interval: 15s
      scrapeTimeout: 10s
  namespaceSelector:
    matchNames:
    - monitoring
  selector:
    matchLabels:
      app: hitl-exporter
Apply it:
$ kubectl -n monitoring apply -f hitl_exporter.yaml
pod/hitl-exporter-pod created
service/hitl-exporter-service created
servicemonitor.monitoring.coreos.com/hitl-exporter-monitor created
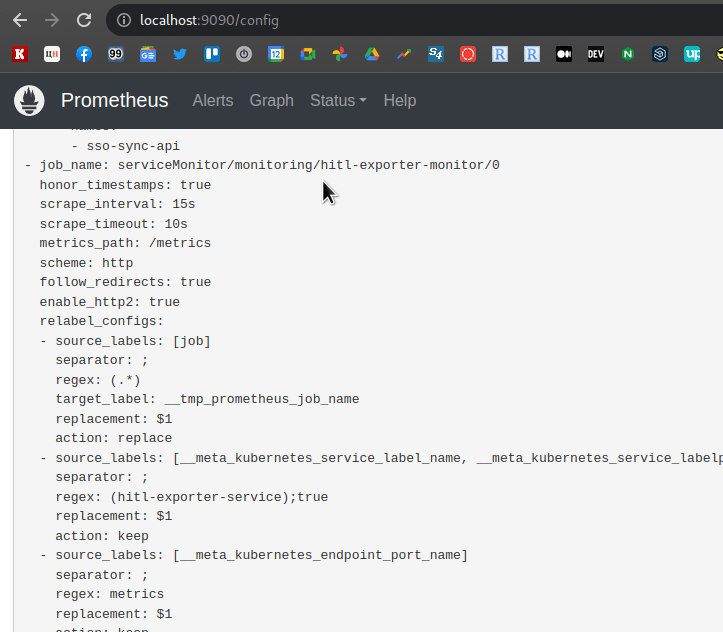
And in a minute or two check the Service Discovery:

Targets:

And Jobs:
Go to the Graphs — and we have our metrics:

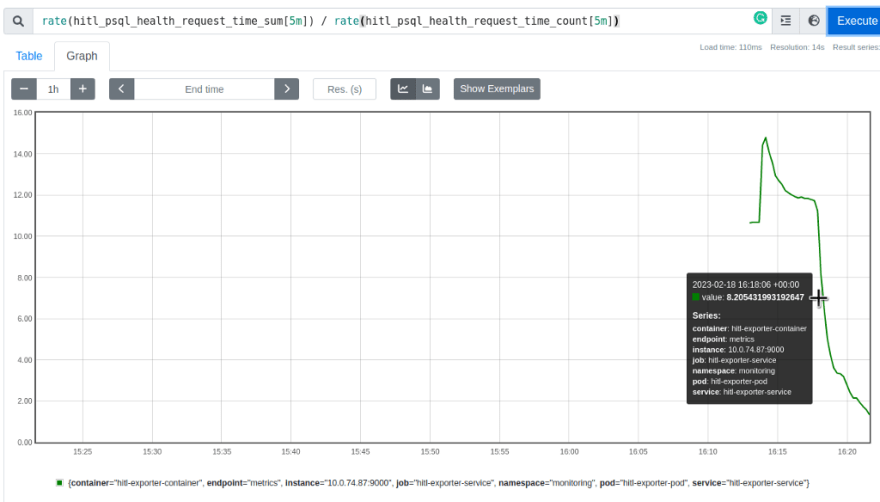
Done.
Originally published at RTFM: Linux, DevOps, and system administration.


Top comments (0)