 Today I decided to upgrade Grafana to already released version 6.0 and all other Docker images as well.
Upgrade was successful – Loki eventually started displaying previously missed log-file names and other tags, just – immediately I got a bunch of CRITICAL alerts in our Slack from the blackbox-exporter which is used to check every our API endpoints.
Actually, in this post – an example of how to debug the blackbox-exporter.
Exactly monitoring’s stack consist of the next containers:
admin@monitoring-production:~$ cat /opt/prometheus/prometheus-compose.yml | grep -B1 image | grep -v image

prometheus-server:
--
grafana-ui:
--
cloudwatch-exporter-us-east-1:
--
cloudwatch-exporter-us-east-2:
--
cloudwatch-exporter-eu-west-1:
--
blackbox-exporter:
--
alertmanager:
--
loki:
--
grafana-loki:
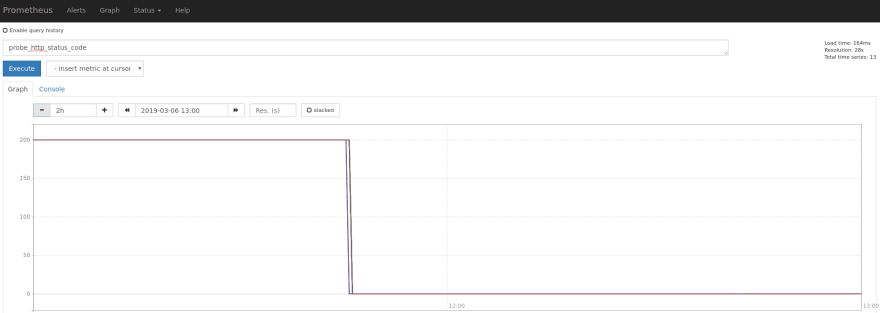
On the Prometheus graphs in looked like:
At the first moment, I was a bit scared as this is real Production API endpoints and alerts… And all of them suddenly “went down”.
But obviously – that was something with the blackbox-exporter itself after Docker images upgrade (and after this, I eventually added Ansible variables with Docker images tags/versions instead of the just “latest“).
Okay – let’s try to debug and find what’s happened.
First – let’s check Google instead of our URLs:
root@monitoring-production:/home/admin# curl -s "localhost:9115/probe?target=https://google.com&module=http_200_module" | grep -v \#
probe_dns_lookup_time_seconds 0.001286702
probe_duration_seconds 0.001563372
probe_failed_due_to_regex 0
probe_http_content_length 0
probe_http_duration_seconds{phase="connect"} 0
probe_http_duration_seconds{phase="processing"} 0
probe_http_duration_seconds{phase="resolve"} 0.001286702
probe_http_duration_seconds{phase="tls"} 0
probe_http_duration_seconds{phase="transfer"} 0
probe_http_redirects 0
probe_http_ssl 0
probe_http_status_code 0
probe_http_version 0
probe_ip_protocol 6
probe_success 0
And the probe_http_status_code 0, and the probe_success 0…
“Something went wrong” (с)
Add the debug=true parameter to the probe’s request:
root@monitoring-production:/home/admin# curl -s "localhost:9115/probe?debug=true&target=https://google.com&module=http_200_module" | grep -v \#
Logs for the probe:
ts=2019-03-06T14:52:43.226669976Z caller=main.go:118 module=http_200_module target=https://google.com level=info msg="Beginning probe" probe=http timeout_seconds=4.5
ts=2019-03-06T14:52:43.226800447Z caller=utils.go:42 module=http_200_module target=https://google.com level=info msg="Resolving target address" ip_protocol=ip6
ts=2019-03-06T14:52:43.227902933Z caller=utils.go:70 module=http_200_module target=https://google.com level=info msg="Resolved target address" ip=2607:f8b0:4009:804::200e
ts=2019-03-06T14:52:43.227948957Z caller=http.go:349 module=http_200_module target=https://google.com level=info msg="Making HTTP request" url=https://[2607:f8b0:4009:804::200e] host=google.com
ts=2019-03-06T14:52:43.228076802Z caller=http.go:364 module=http_200_module target=https://google.com level=error msg="Error for HTTP request" err="Get https://[2607:f8b0:4009:804::200e]: dial tcp [2607:f8b0:4009:804::200e]:443: connect: cannot assign requested address"
ts=2019-03-06T14:52:43.228098528Z caller=http.go:450 module=http_200_module target=https://google.com level=info msg="Response timings for roundtrip" roundtrip=0 start=2019-03-06T14:52:43.227999657Z dnsDone=2019-03-06T14:52:43.227999657Z connectDone=2019-03-06T14:52:43.228064489Z gotConn=0001-01-01T00:00:00Z responseStart=0001-01-01T00:00:00Z end=0001-01-01T00:00:00Z
ts=2019-03-06T14:52:43.228120026Z caller=main.go:131 module=http_200_module target=https://google.com level=error msg="Probe failed" duration_seconds=0.001397763

Metrics that would have been returned:
...
probe_http_status_code 0
probe_http_version 0
probe_ip_protocol 6
probe_success 0
Module configuration:
prober: http
timeout: 5s
Eeeerrr…
ts=2019-03-06T14:52:43.227948957Z caller=http.go:349 module=http_200_module target=https://google.com level=info msg=”Making HTTP request” url=https://[2607:f8b0:4009:804::200e] host=google.com
ts=2019-03-06T14:52:43.228076802Z caller=http.go:364 module=http_200_module target=https://google.com level=error msg=”Error for HTTP request” err=”Get https://[2607:f8b0:4009:804::200e]: dial tcp [2607:f8b0:4009:804::200e]:443: connect:
cannot assign requested address”
url=https://[2607:f8b0:4009:804::200e] host=google.com – WTF? IP v6? But there always IP v4 was used…
Check the blackbox_exporter‘s documentation:
...
# The IP protocol of the HTTP probe (ip4, ip6).
[preferred_ip_protocol: <string> | default = "ip6"]
...
Ah, well, okay…
The default version was changed.
Suddenly – IP v6 used much more in the world then I thought.
You can check the statistic on the ipv6-test.com.
OK – update config and set ip4 explicitly:
modules:
  icmp:
    prober: icmp
    timeout: 5s
  http_200_module:
    prober: http
    timeout: 5s
    http:
      preferred_ip_protocol: ip4
      valid_status_codes: [200]
      method: GET
      no_follow_redirects: true
      fail_if_not_ssl: true
Check again:
root@monitoring-production:/home/admin# curl -s "localhost:9115/probe?debug=true&target=https://google.com&module=http_200_module" | grep -v \#

Logs for the probe:
ts=2019-03-06T14:57:41.827341666Z caller=main.go:118 module=http_200_module target=https://google.com level=info msg="Beginning probe" probe=http timeout_seconds=4.5
ts=2019-03-06T14:57:41.82743191Z caller=utils.go:42 module=http_200_module target=https://google.com level=info msg="Resolving target address" ip_protocol=ip4
ts=2019-03-06T14:57:41.847978323Z caller=utils.go:70 module=http_200_module target=https://google.com level=info msg="Resolved target address" ip=172.217.8.174
ts=2019-03-06T14:57:41.848021827Z caller=http.go:349 module=http_200_module target=https://google.com level=info msg="Making HTTP request" url=https://[172.217.8.174] host=google.com
ts=2019-03-06T14:57:41.949592972Z caller=http.go:305 module=http_200_module target=https://google.com level=info msg="Received redirect" url=https://www.google.com/
ts=2019-03-06T14:57:42.075895742Z caller=http.go:368 module=http_200_module target=https://google.com level=info msg="Received HTTP response" status_code=200
ts=2019-03-06T14:57:42.078492632Z caller=http.go:450 module=http_200_module target=https://google.com level=info msg="Response timings for roundtrip" roundtrip=0 start=2019-03-06T14:57:41.848092002Z dnsDone=2019-03-06T14:57:41.848092002Z connectDone=2019-03-06T14:57:41.867216977Z gotConn=2019-03-06T14:57:41.917500103Z responseStart=2019-03-06T14:57:41.949545477Z end=0001-01-01T00:00:00Z
ts=2019-03-06T14:57:42.078528466Z caller=http.go:450 module=http_200_module target=https://google.com level=info msg="Response timings for roundtrip" roundtrip=1 start=2019-03-06T14:57:41.949692456Z dnsDone=2019-03-06T14:57:41.950657776Z connectDone=2019-03-06T14:57:41.969811463Z gotConn=2019-03-06T14:57:42.020416388Z responseStart=2019-03-06T14:57:42.075831768Z end=2019-03-06T14:57:42.078481538Z
ts=2019-03-06T14:57:42.078563182Z caller=main.go:129 module=http_200_module target=https://google.com level=info msg="Probe succeeded" duration_seconds=0.251186806

Metrics that would have been returned:
...
probe_http_status_code 200
probe_http_version 1.1
probe_ip_protocol 4
probe_ssl_earliest_cert_expiry 1.5586899e+09
probe_success 1
Module configuration:
prober: http
timeout: 5s
http:
preferred_ip_protocol: ip4
(3xx appeared necause of the no_follow_redirects: true added to the config)
Everything went back to the OK state.
Done.
Similar posts
- 07/27/2018 Prometheus: Alertmanager и blackbox-exporter – проверка срока действия SSL и нотификация в Slack (0)
- 02/13/2019 Grafana Labs: Loki – using AWS S3 as a data storage and AWS DynamoDB for indexes (0)
- 10/30/2018 Prometheus: роутинг алертов в Alertmanager (0)
- 08/15/2018 Prometheus: проверка отсутствия метрик – avg_over_time() (0)


Top comments (0)