
Tracing allows you to track requests between components, that is, for example, when using AWS and Kubernetes we can trace the entire path of a request from AWS Load Balancer to Kubernetes Pod and to DynamoDB or RDS.
This helps us both to track performance issues — where and which requests are taking a long time to execute — and to have additional information when problems arise, for example, when our API returns 500 errors to clients, and we need to find out which component of the system is causing the problem.
AWS has a service for tracing called X-Ray, where we can send data using AWS X-Ray SDK for Python or AWS Distro for OpenTelemetry Python (or other languages, but we’ll talk about Python here).
AWS X-Ray adds a unique X-Ray ID to each request and allows you to build a picture of the full “route” of the request.
Also, in Kubernetes we can trace with tools like Jaeger or Zipkin, and then build the picture in Grafana Tempo.
Another way is to use the X-Ray Daemon, which we can run in Kubernetes, and add the X-Ray plugin to Grafana. See Introducing the AWS X-Ray integration with Grafana for examples.
Additionally, AWS Distro for OpenTelemetry also works with AWS X-Ray-compliant Trace IDs — see AWS Distro for OpenTelemetry and AWS X-Ray and Collecting traces from EKS with ADOT.
Today, however, we will be adding an X-Ray collector that will create a Kubernetes DaemonSet and a Kubernetes Service to which Kubernetes Pods can send data that we can then see either in the AWS X-Ray Console or in Grafana.
AWS IAM
IAM Policy
To access AWS API from X-Ray daemon Pods, we need to create an IAM Role, which we will then use in the ServiceAccount for X-Ray.
We still use the old way of adding IAM Role via ServiceAccounts, see Kubernetes: ServiceAccount from AWS IAM Role for Kubernetes Pod, although AWS recently announced the Amazon EKS Pod Identity Agent add-on — see AWS: EKS Pod Identities — a replacement for IRSA? Simplifying IAM access management.
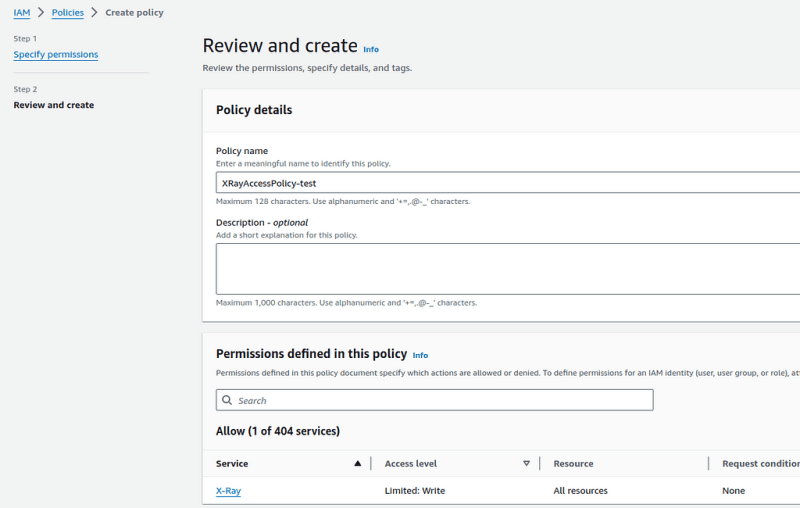
So, create an IAM Policy with permissions to write to X-Ray:
{
    "Version": "2012-10-17",
    "Statement": [
        {
            "Effect": "Allow",
            "Action": [
                "xray:PutTraceSegments",
                "xray:PutTelemetryRecords"
            ],
            "Resource": [
                "*"
            ]
        }
    ]
}
Save it:
IAM Role
Next, add an IAM Role that the Kubernetes ServiceAccount can use.
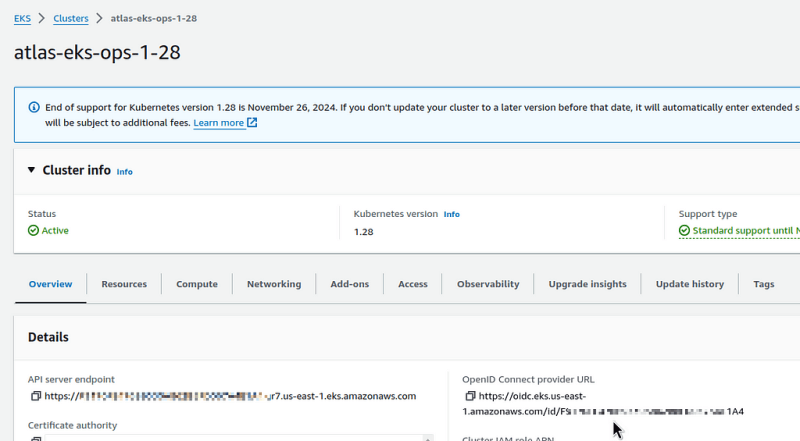
Find the Identity provider of our EKS cluster:
Go to the IAM Roles, add a new role.
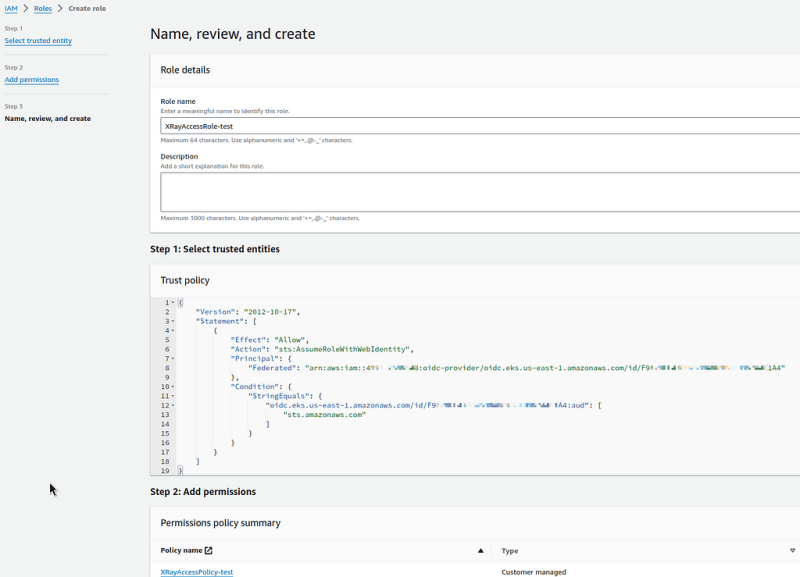
In the Trusted entity type, select Web Identity, and in Web identity select the Identity provider of our EKS, and in the Audience field — set the AWS STS endpoint:

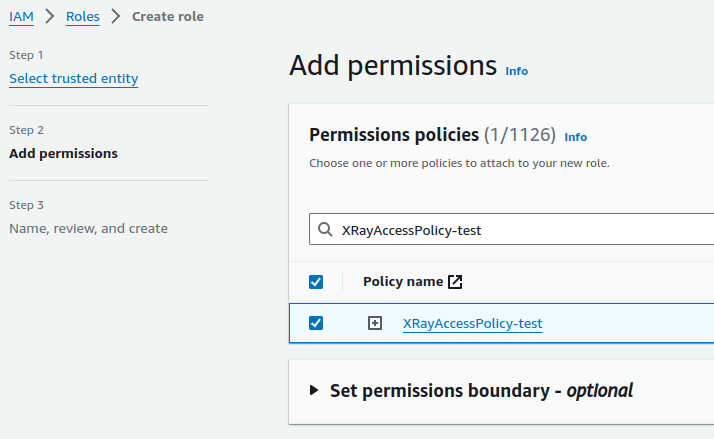
Attach the IAM Policy created above:
Save it:
Running X-Ray Daemon in Kubernetes
Let’s use the okgolove/aws-xray Helm chart.
Create x-ray-values.yaml file, see the default values in values.yaml:
serviceAccount:
  annotations:
    eks.amazonaws.com/role-arn: arn:aws:iam::492***148:role/XRayAccessRole-test
xray:
  region: us-east-1
  loglevel: prod
Add a repository:
$ helm repo add okgolove https://okgolove.github.io/helm-charts/
Install the chart into the cluster, this will create a DaemonSet and a Service:
$ helm -n ops-monitoring-ns install aws-xray okgolove/aws-xray -f x-ray-values.yaml
Check the Pods:
$ kk get pod -l app.kubernetes.io/name=aws-xray
NAME READY STATUS RESTARTS AGE
aws-xray-5n2kt 0/1 Pending 0 41s
aws-xray-6cwwf 1/1 Running 0 41s
aws-xray-7dk67 1/1 Running 0 41s
aws-xray-cq7xc 1/1 Running 0 41s
aws-xray-cs54v 1/1 Running 0 41s
aws-xray-mjxlm 0/1 Pending 0 41s
aws-xray-rzcsz 1/1 Running 0 41s
aws-xray-x5kb4 1/1 Running 0 41s
aws-xray-xm9fk 1/1 Running 0 41s
And Kubernetes Service:
$ kk get svc -l app.kubernetes.io/name=aws-xray
NAME TYPE CLUSTER-IP EXTERNAL-IP PORT(S) AGE
aws-xray ClusterIP None <none> 2000/UDP,2000/TCP 77s
Checking and working with X-Ray
Create a Python Flask HTTP App with X-Ray
Let’s create a service on Python Flask that will respond to HTTP requests and log X-ray IDs ( ChatGPT promt — “Create a simple Python App with AWS X-Ray SDK for Python to run in Kubernetes. Add X-Ray ID output to requests”):
from flask import Flask
from aws_xray_sdk.core import xray_recorder
from aws_xray_sdk.ext.flask.middleware import XRayMiddleware
import logging

app = Flask( __name__ )

# Configure AWS X-Ray
xray_recorder.configure(service='SimpleApp')
XRayMiddleware(app, xray_recorder)

# Set up basic logging
logging.basicConfig(level=logging.INFO)

@app.route('/')
def hello():
    # Retrieve the current X-Ray segment
    segment = xray_recorder.current_segment()
    # Get the trace ID from the current segment
    trace_id = segment.trace_id if segment else 'No segment'
    # Log the trace ID
    logging.info(f"Responding to request with X-Ray trace ID: {trace_id}")

    return f"Hello, X-Ray! Trace ID: {trace_id}\n"

if __name__ == ' __main__':
    app.run(debug=True, host='0.0.0.0', port=5000)
Create requirements.txt:
flask==2.0.1
werkzeug==2.0.0
aws-xray-sdk==2.7.0
Add Dockerfile:
FROM python:3.8-slim

COPY requirements.txt .
RUN pip install --force-reinstall -r requirements.txt

COPY app.py .

CMD ["python", "app.py"]
Build a Docker image — here we use a repository in AWS ECR:
$ docker build -t 492***148.dkr.ecr.us-east-1.amazonaws.com/x-ray-test .
Log in to the ECR:
$ aws ecr get-login-password --region us-east-1 | docker login --username AWS --password-stdin 492***148.dkr.ecr.us-east-1.amazonaws.com
Push the image:
$ docker push 492***148.dkr.ecr.us-east-1.amazonaws.com/x-ray-test
Run Flask App in Kubernetes
Create a manifest with Kubernetes Deployment, Service, and Ingress.
For Ingress, enable logging into an AWS S3 bucket — logs will be collected from it to Grafana Loki, see Grafana Loki: collecting AWS LoadBalancer logs from S3 with Promtail Lambda.
For Deployment, set the AWS_XRAY_DAEMON_ADDRESS environment variable, with the URL of the Kubernetes Service of our X-Ray Daemon:
apiVersion: apps/v1
kind: Deployment
metadata:
  name: flask-app
spec:
  replicas: 2
  selector:
    matchLabels:
      app: flask-app
  template:
    metadata:
      labels:
        app: flask-app
    spec:
      containers:
      - name: flask-app
        image: 492***148.dkr.ecr.us-east-1.amazonaws.com/x-ray-test
        ports:
        - containerPort: 5000
        env:
          - name: AWS_XRAY_DAEMON_ADDRESS
            value: "aws-xray.ops-monitoring-ns.svc.cluster.local:2000"
          - name: AWS_REGION
            value: "us-east-1"
---
apiVersion: v1
kind: Service
metadata:
  name: flask-app-service
spec:
  selector:
    app: flask-app
  ports:
    - protocol: TCP
      port: 80
      targetPort: 5000
---
apiVersion: networking.k8s.io/v1
kind: Ingress
metadata:
  name: flask-app-ingress
  annotations:
    alb.ingress.kubernetes.io/scheme: "internet-facing"
    alb.ingress.kubernetes.io/target-type: "ip"
    alb.ingress.kubernetes.io/listen-ports: '[{"HTTP": 80}]'
    alb.ingress.kubernetes.io/load-balancer-attributes: access_logs.s3.enabled=true,access_logs.s3.bucket=ops-1-28-devops-monitoring-ops-alb-logs
spec:
  ingressClassName: alb
  rules:
  - http:
      paths:
      - path: /
        pathType: Prefix
        backend:
          service:
            name: flask-app-service
            port:
              number: 80
Deploy it and check Ingress/ALB:
$ kk get ingress
NAME CLASS HOSTS ADDRESS PORTS AGE
flask-app-ingress alb * k8s-default-flaskapp-25042181e0-298318111.us-east-1.elb.amazonaws.com 80 10m
Make a request to the endpoint:
$ curl k8s-default-flaskapp-25042181e0-298318111.us-east-1.elb.amazonaws.com
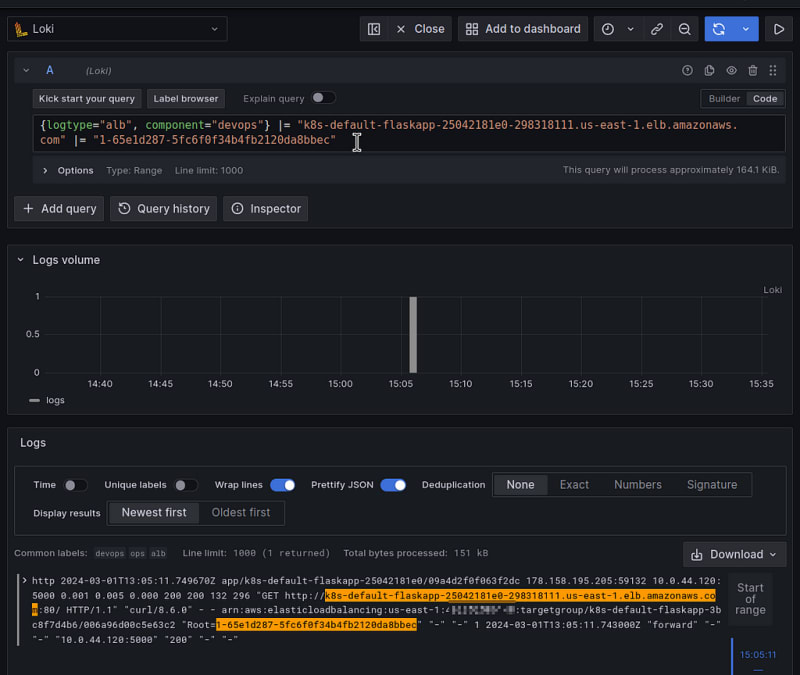
Hello, X-Ray! Trace ID: 1-65e1d287-5fc6f0f34b4fb2120da8bbec
And we see the X-Ray ID.
We can also see it in the Load Balancer Access Logs:
And in the X-Ray itself:

Although, I expected the Load Balancer to be in the request map too, but it wasn’t.
Grafana X-Ray data source
Add a new Data source:

Configure access to AWS — here it’s simple with ACCESS and SECRET keys (see X-Ray documentation):

And now we have a new data source in Explore:

And a new type of visualization — Traces:

And somewhere in another post I will probably describe the creation of a real dashboard with X-Ray.
Originally published at RTFM: Linux, DevOps, and system administration.


Top comments (0)