
I didn’t plan this post at all as I thought I would do it quickly, but it didn’t work out quickly, and I need to dig a little deeper into this topic.
So, what we are talking about: we have AWS Load Balancers, logs from which are collected to Grafana Loki, see. Grafana Loki: collecting AWS LoadBalancer logs from S3 with Promtail Lambda.
In Loki, we have Recording Rules and a remote write, which generates some metrics and writes them to VictoriaMetrics, from where they are used by VMAlert and Grafana — see Grafana Loki: performance optimization with Recording Rules, caching, and parallel queries.
What I want to do is to generate Load Balancers graphs in Grafana not from CloudWatch metrics, but from logs, because, firstly, collecting metrics from CloudWatch in Prometheus/VictoriaMetrics costs money for queries to CloudWatch, secondly, we can get much more information from logs, and thirdly, CloudWatch metrics have limitations that we can get around with logs.
For example, if several domains are connected to the same load balancer, we won’t see which host the requests were made to in CloudWatch metrics, but we can get this information from the logs.
Also, some metrics do not give the picture I want, such as the ProcessedBytes metric, which has a value for "traffic to and from clients", but no information on received and sent bytes.
So what are we going to do?
- deploy a test environment in Kubernetes — a Pod and an Ingress/ALB with logging to S3
- set up log collection from S3 via a Lambda function with Promtail
- will take a look at the fields in ALB Access Logs — which may be of interest to us
- will think about what graphs we would like to have for the Grafana dashboard and, accordingly, what metrics we may need for this
- create queries for Loki which will generate data from the AWS LoadBalancer log
- and write a few Loki Recording Rules that will generate the necessary metrics
Test environment in Kubernetes
We need a Pod that will generate HTTP responses and an Ingress that will create an AWS ALB from which we will collect logs.
I’ll describe it briefly here, because basically everything is described quite well in the above post — at least I managed to manually repeat it all again for this test environment.
Also, I will not describe here the Promtail Lambda creation, but you can find how I ran it in the Running Lambda Promtail blog.
Create a bucket for logs:
$ aws --profile work s3api create-bucket --bucket eks-alb-logs-test --region us-east-1
Create a file with an IAM Policy:
{
    "Version": "2012-10-17",
    "Statement": [
        {
            "Effect": "Allow",
            "Principal": {
                "AWS": "arn:aws:iam::127311923021:root"
            },
            "Action": "s3:PutObject",
            "Resource": "arn:aws:s3:::eks-alb-logs-test/AWSLogs/492***148/*"
        },
        {
            "Effect": "Allow",
            "Principal": {
                "AWS": "arn:aws:iam::492***148:role/grafana-atlas-monitoring-ops-1-28-loki-logger-devops-alb"
            },
            "Action": "s3:GetObject",
            "Resource": "arn:aws:s3:::eks-alb-logs-test/*"
        }
    ]
}
Add this policy to the bucket:
$ aws --profile work s3api put-bucket-policy --bucket eks-alb-logs-test --policy file://s3-alb-logs-policy.json
In the bucket, configure Properties > Event notifications for ObjectCreated events:
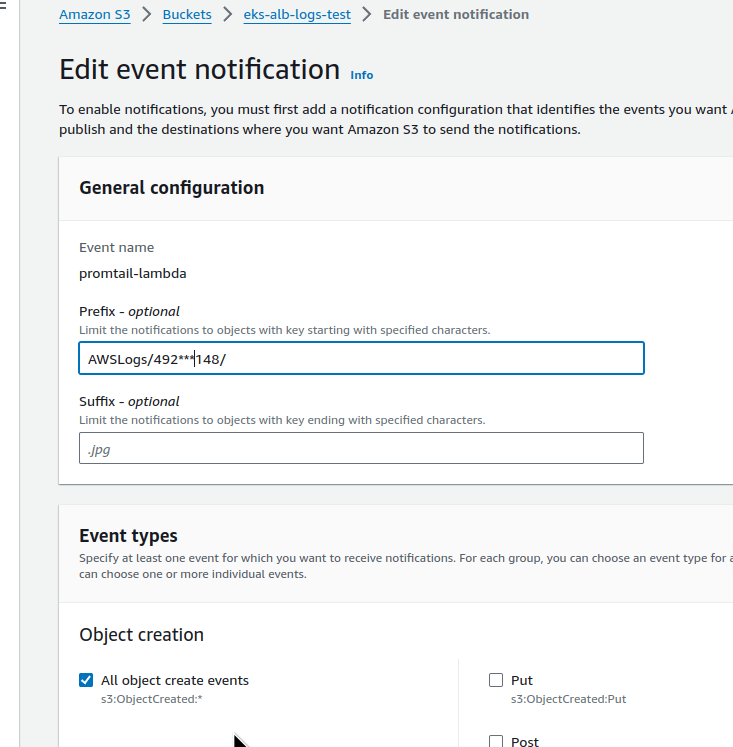
Set the Destination to the Lambda from Promtail:

Describe resources for Kubernetes — a Deployment, a Service, and an Ingress.
In the Ingress annotations, set access_logs.
In addition, you need TLS, because we will take domain name records in requests from it:
apiVersion: apps/v1
kind: Deployment
metadata:
  name: nginx-demo-deployment
spec:
  replicas: 1
  selector:
    matchLabels:
      app: nginx-demo
  template:
    metadata:
      labels:
        app: nginx-demo
    spec:
      containers:
        - name: nginx-demo-container
          image: nginx
          ports:
            - containerPort: 80

---
apiVersion: v1
kind: Service
metadata:
  name: nginx-demo-service
spec:
  selector:
    app: nginx-demo
  ports:
    - protocol: TCP
      port: 80
      targetPort: 80
  type: ClusterIP

---
apiVersion: networking.k8s.io/v1
kind: Ingress
metadata:
  name: example-ingress
  annotations:
    alb.ingress.kubernetes.io/scheme: internet-facing
    alb.ingress.kubernetes.io/target-type: ip
    alb.ingress.kubernetes.io/listen-ports: '[{"HTTPS":443}, {"HTTP":80}]'
    alb.ingress.kubernetes.io/load-balancer-attributes: access_logs.s3.enabled=true,access_logs.s3.bucket=eks-alb-logs-test
    alb.ingress.kubernetes.io/certificate-arn: arn:aws:acm:us-east-1:492***148:certificate/bab1c48a-d11e-4572-940e-2cd43aafb615
spec:
  ingressClassName: alb
  rules:
    - host: test-alb-logs-1.setevoy.org.ua
      http:
        paths:
          - path: /
            pathType: Prefix
            backend:
              service:
                name: nginx-demo-service
                port:
                  number: 80
Let’s deploy it:
$ kk apply -f ingress-svc-deploy.yaml
deployment.apps/nginx-demo-deployment created
service/nginx-demo-service created
ingress.networking.k8s.io/example-ingress created
Check the Ingress and its Load Balancer:
$ kk get ingress example-ingress
NAME CLASS HOSTS ADDRESS PORTS AGE
example-ingress alb test-alb-logs-1.setevoy.org.ua k8s-opsmonit-examplei-8f89ccef47-1707845441.us-east-1.elb.amazonaws.com 80 2m40s
Check with cURL that everything works:
$ curl -I https://test-alb-logs.setevoy.org.ua
HTTP/1.1 200 OK
It makes sense to add a Security Group where you can deny access to everyone except your IP to be sure of the results during testing.
Application Load Balancer: useful fields in the Access Log
Documentation — Access logs for your Application Load Balancer.
What can we find interesting for us in the logs?
Keep in mind that in our case, Load Balancer’s target will be Kubernetes Pods:
-
type: We have some ALBs using WebSockets, so it was nice to be able to highlight them -
time: time to create a response to the client - not that it is needed in the Grafana, but let it be -
elb: a Load Balancer ID - useful in alerts and can be used in Grafana graph filters -
client:portandtarget:port: from where a request came and where it went; in our case,target:portwill be a Pod IP -
request_processing_time: time from receiving a request from the client to transmitting it to the Pod -
target_processing_time: time from sending a request to Pod to receiving a response from Pod -
response_processing_time: time from receiving a response from the Pod to the start of the response transmission to the client -
elb_status_code: HTTP code from an ALB to the client -
target_status_code: HTTP code from a Pod to an ALB -
received_bytes: bytes received from the client - for HTTP includes the size of headers, for WebSockets - the total number of bytes transferred within the connection -
sent_bytes: similarly, but for a respond to the client - request: full URL of the request from the client in the form of
HTTP method + protocol://host:port/uri + HTTP version -
user_agent: a User Agent -
target_group_arn: Amazon Resource Name (ARN) for the Target Group for which the requests are being corrected -
trace_id: X-Ray ID - useful if you use it (I made data links in Grafana to a dashboard with X-Ray) -
domain_name: on a HTTPS Listener - the host name in the request during the TLS handshake (the actual domain that the client used) -
actions_executed: can be useful especially if you use AWS WAF, see Actions taken -
error_reason: an error reason if the request failed - I don't use it, but it can be useful, see Error reason codes -
target:port_list: similar to thetarget:port -
target_status_code_list: similar to thetarget_status_code
Grafana Loki: Application Load Balancer logs, and a LogQL pattern
Knowing the existing fields, we can create a query that will generate Fields from the logs. And then we can use these fields either to create labels or to build graphs.
Official documentation on the topic:
And my post Grafana Loki: LogQL for logs and creating metrics for alerts.
When working with Load Balancer logs in Loki, keep in mind that it takes 5 minutes for the data to reach Loki from the moment of the request — and this, in addition to the fact that we see data with a delay, will create some other problems that we will analyze later.
Let’s use the pattern parser, which will set the names of the fields we want to create: for each field in the log, we will make a separate <field> in Loki:
pattern `<type> <date> <elb_id> <client_ip> <pod_ip> <request_processing_time> <target_processing_time> <response_processing_time> <elb_code> <target_code> <received_bytes> <sent_bytes> "<request>" "<user_agent>" <ssl_cipher> <ssl_protocol> <target_group_arn> "<trace_id>" "<domain>" "<chosen_cert_arn>" <matched_rule_priority> <request_creation_time> "<actions_executed>" "<redirect_url>" "<error_reason>" "<target>" "<target_status_code>" "<_>" "<_>"`
At the end, we skip two fields through <_> - classification and classification_reason, because I don't see where it would be useful yet.
Now, all of the entries in Loki together with a Stream Selector will look like this:
{logtype="alb", component="devops"} |= "test-alb-logs.setevoy.org.ua" | pattern `<type> <date> <elb_id> <client_ip> <pod_ip> <request_processing_time> <target_processing_time> <response_processing_time> <elb_code> <target_code> <received_bytes> <sent_bytes> "<request>" "<user_agent>" <ssl_cipher> <ssl_protocol> <target_group_arn> "<trace_id>" "<domain>" "<chosen_cert_arn>" <matched_rule_priority> <request_creation_time> "<actions_executed>" "<redirect_url>" "<error_reason>" "<target>" "<target_status_code>" "<_>" "<_>"`
Or, as we already have a domain field, instead of the Line filter expression, let's use a Label filter expression - domain="test-alb-logs.setevoy.org.ua":
{logtype="alb", component="devops"}
| pattern `<type> <date> <elb_id> <client_ip> <pod_ip> <request_processing_time> <target_processing_time> <response_processing_time> <elb_code> <target_code> <received_bytes> <sent_bytes> "<request>" "<user_agent>" <ssl_cipher> <ssl_protocol> <target_group_arn> "<trace_id>" "<domain>" "<chosen_cert_arn>" <matched_rule_priority> <request_creation_time> "<actions_executed>" "<redirect_url>" "<error_reason>" "<target>" "<target_status_code>" "<_>" "<_>"`
| domain="test-alb-logs.setevoy.org.ua"

HTTP Load testing tools
Next, we need something to make requests to our Load Balancer to generate logs, and to be able to set specific parameters such as the number of requests per second.
I tried several different utilities, such as Vegeta:
$ echo "GET https://test-alb-logs.setevoy.org.ua/" | vegeta attack -rate=1 -duration=60s | vegeta report
Requests [total, rate, throughput] 60, 1.02, 1.01
Duration [total, attack, wait] 59.126s, 59s, 125.756ms
Latencies [min, mean, 50, 90, 95, 99, max] 124.946ms, 133.825ms, 126.062ms, 127.709ms, 128.203ms, 542.437ms, 588.428ms
Bytes In [total, mean] 36900, 615.00
Bytes Out [total, mean] 0, 0.00
Success [ratio] 100.00%
Status Codes [code:count] 200:60
Error Set:
Or wrk2:
$ wrk2 -c1 -t1 -d60s -R1 https://test-alb-logs.setevoy.org.ua/
Running 1m test @ https://test-alb-logs.setevoy.org.ua/
  1 threads and 1 connections
  Thread calibration: mean lat.: 166.406ms, rate sampling interval: 266ms
  Thread Stats Avg Stdev Max +/- Stdev
    Latency 127.77ms 0.94ms 131.97ms 80.00%
    Req/Sec 0.80 1.33 3.00 100.00%
  60 requests in 1.00m, 49.98KB read
Requests/sec: 1.00
Transfer/sec: 852.93B
wrk2 for fit better because it's simpler.
Of course, you can also use Bash and Apache Benchmark:
#!/bin/bash
for i in {1..60}
do
  ab -n 1 -c 1 https://test-alb-logs.setevoy.org.ua/
  sleep 1
done
But these are a bit of extra crutches.
Or use JMeter — but this is completely overkill for our needs.
Grafana dashboard: planning
There are ready-made dashboards for ALB, for example, AWS ELB Application Load Balancer by Target Group and AWS ALB Cloudwatch Metrics, so we can take ideas for the charts we will build from them.
I won’t describe the creation of the dashboard itself in this post, because it’s already quite long, but let’s think about what we would like to have.
You can read more about creating a dashboard in, for example, in the Karpenter: its monitoring, and Grafana dashboard for Kubernetes WorkerNodes, but here we will focus on Loki queries.
Filters:
-
domain — take values from the
domainfield (looking ahead - the querylabel_values(aws:alb:requests:sum_by:rate:1m,domain)) -
alb_id — with a filter by
$domain(querylabel_values(aws:alb:requests:sum_by:rate:1m{domain=~"$domain"),domain))
Next, on the board itself, there will be all kinds of Stats at the top, and graphs below them.
In the Stats:
- requests/sec : per-second rate of requests per second
- response time : total response time to the client
- 4xx rate та 5xx rate : per-second error rate
- received та transmitted throughput : how many bytes per second we receive and send
- client connections : total number of connections
And the graphs for each Load Balancer selected in the filter:
- HTTP codes by ALB : general picture by customer response codes, per-second rate
- HTTP code by targets : general picture by response codes from Pods, per-second rate
- 4xx/5xx graph : graph by errors, per-second rate
- requests total : graph on the total number of requests from customers
- ALB response time : total response time to clients
- target response time : response time from Pods
- received та transmitted throughput : how many bytes per second we receive and send
Creating metrics with Loki Recording Rules
Run the test — 1 request per second:
$ wrk2 -c1 -t1 -R1 -H "User-Agent: wrk2" -d30m https://test-alb-logs-1.setevoy.org.ua/
And let’s go to create requests.
A LogQL query for the requests/sec
The first thing that comes to mind getting the per-second rate of requests is to use the rate() function:
rate(log-range): calculates the number of entries per second
In the rate() we use our stream selector {logtype="alb", component="devops"} (I set these labels on the Lambda Promtail) and a pattern parser to create fields with values that we will use later:
To get the total result for all the records found, let’s wrap our query in the sum() function:
sum(
    rate(
        {logtype="alb", component="devops"}
            | pattern `<type> <date> <elb_id> <client_ip> <pod_ip> <request_processing_time> <target_processing_time> <response_processing_time> <elb_code> <target_code> <received_bytes> <sent_bytes> "<request>" "<user_agent>" <ssl_cipher> <ssl_protocol> <target_group_arn> "<trace_id>" "<domain>" "<chosen_cert_arn>" <matched_rule_priority> <request_creation_time> "<actions_executed>" "<redirect_url>" "<error_reason>" "<target>" "<target_status_code>" "<_>" "<_>"`
            | domain="test-alb-logs.setevoy.org.ua"
            [1m]
    )
)
If we want to create a metric that will have the ALB name and domain name in the labels so that we can use these labels in Grafana dashboard filters, we can add a sum by (elb_id, domain):

And now we have a value for the number of all unique pairs elb_id, domain - 1 request per second, as we set in wrk2 -c1 -t1 -R1.
Looks like everything is great?
But let’s try to use this query in Loki Recording Rules and create a metric based on it.
Loki Recording Rule for metrics and an issue with AWS Load Balancer Logs EmitInterval
Add a record to create a aws:alb:requests:sum_by:rate:1m metric:
kind: ConfigMap
apiVersion: v1
metadata:
  name: loki-alert-rules
data:
  rules.yaml: |-
    groups:
      - name: AWS-ALB-Metrics-1
        rules:
        - record: aws:alb:requests:sum_by:rate:1m
          expr: |
            sum by (elb_id, domain) (
                rate(
                    {logtype="alb", component="devops"}
                        | pattern `<type> <date> <elb_id> <client_ip> <pod_ip> <request_processing_time> <target_processing_time> <response_processing_time> <elb_code> <target_code> <received_bytes> <sent_bytes> "<request>" "<user_agent>" <ssl_cipher> <ssl_protocol> <target_group_arn> "<trace_id>" "<domain>" "<chosen_cert_arn>" <matched_rule_priority> <request_creation_time> "<actions_executed>" "<redirect_url>" "<error_reason>" "<target>" "<target_status_code>" "<_>" "<_>"`
                        | domain="test-alb-logs-1.setevoy.org.ua"
                        [1m]
                )
            )
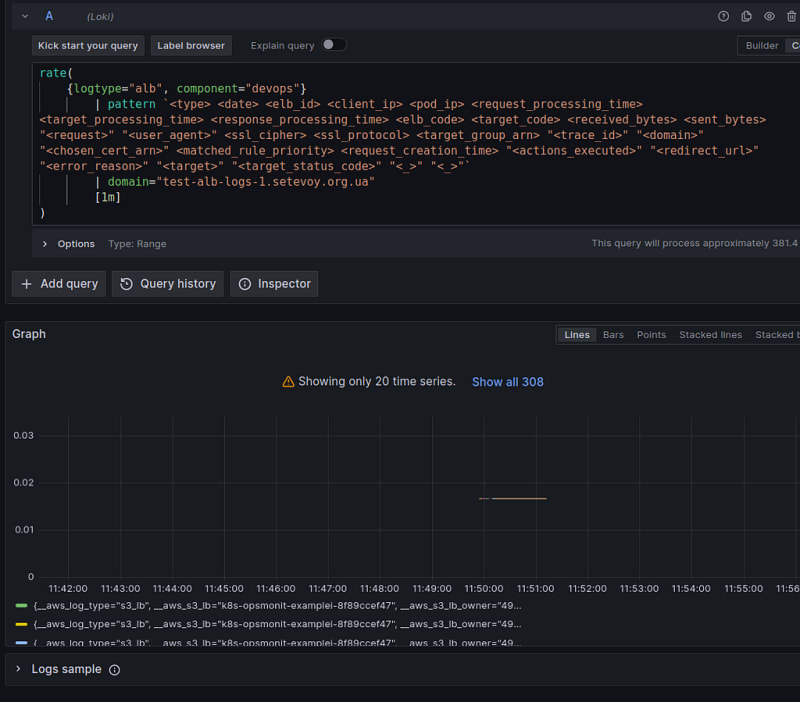
Deploy it and check the metric in VictoriaMetrics:

WTF?!?
Firstly, why is the value 0.3 , not 1?
Secondly, why do we end up with gaps in the line?
AWS Load Balancer and logs EmitInterval
Let’s go back to Loki and increase the interval for the rate() to 5 minutes:
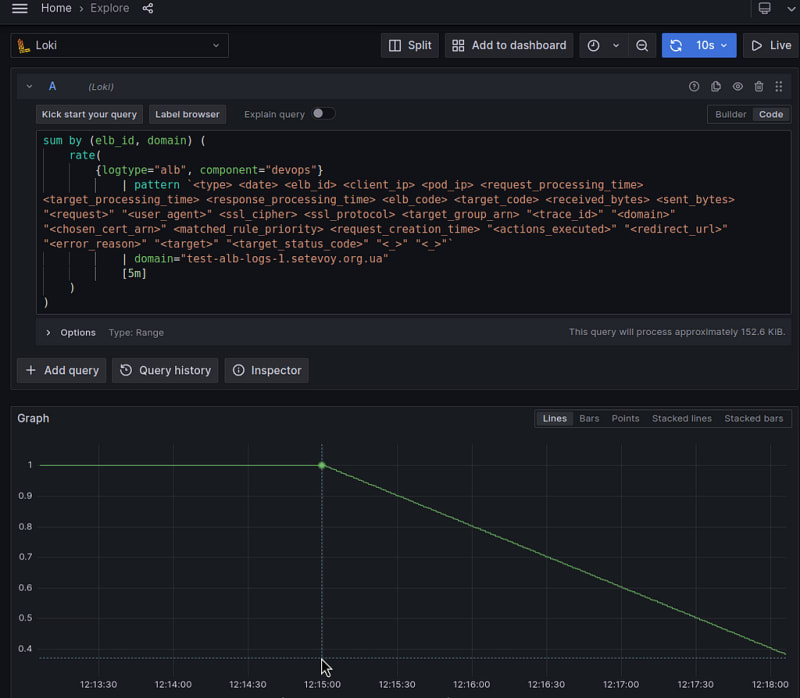
As a result, we see that the value gradually decreases from 1 to zero.
Why?
Because logs from LoadBalancer to S3 are collected every 5 minutes — see Access log files:
Elastic Load Balancing publishes a log file for each load balancer node every 5 minutes
In Classic Load Balancer, it is possible to configure the frequency of logs transfer to S3 with the EmitInterval parameter, but in Application Load Balancer, this value is fixed at 5 minutes.
And how does the rate() function work?
At the moment of the call, it takes all the values for a given period of time minus the last 5 minutes in our case, rate({...}[5m]), and forms an average value per second:
calculates per second rate of all values in the specified interval
So the picture is as follows:

So when we call the rate() at 12:28, it takes data for the interval 12:23-12:28 , but at this point we have the rest of the logs only until 12:25, and therefore the value returned by rate() decreases with each next minute.
When new logs arrive at Loki, rate() processes them all, and the line is equalized to 1.
Okay, that’s more or less clear.
Now, what about the graphs in Prometheus/VictoriaMetrics that we build from the aws:alb:requests:sum_by:rate:1m metric?
Here, the picture is even more interesting, because Loki Ruler makes requests once a minute:
_# How frequently to evaluate rules.
CLI flag: -ruler.evaluation-interval
[evaluation_interval: | default = 1m]_
That is, the request was executed at 12:46:42:


(the time on the UTC server is -2 hours from the time in the VictoriaMetrics VMUI, so it is 10:46:42, not 12:46:42)
And it got the value “0.3” because there were no new logs:

And even if we increase the time in rate() to 5 minutes in the Recording Rule, we still don't have the right picture, because part of the time period will not have logs yet.
Trouble.
LogQL and offset
So what can we do?
I’ve been trying to find a solution for quite a while, and tried the count_over_time option, and thought to try the ruler_evaluation\_delay_duration solution as described in the Loki recording rule range query, and thought about trying to play around with the Ruler evaluation_interval, but I came up with a much simpler and probably more correct solution - why not use offset?
I wasn’t sure if LogQL supports it, but as it turned out, it does:

With the offset 5m, we "shift" the beginning of our query: instead of taking the data for the last minute, we take the data 5 minutes earlier + our minute in the rate(), and then we already have all the logs.
This, of course, breaks the overall picture a bit, because we won’t get the most up-to-date data, but we already have it with a 5-minute delay, and such delays are not critical for Load Balancer charts and alerts, so, IMHO, the solution is quite valid.
Add a new metric aws:alb:requests:sum_by:rate:1m:offset:5m:
...
        - record: aws:alb:requests:sum_by:rate:1m:offset:5m
          expr: |
            sum by (elb_id, domain) (
                rate(
                    {logtype="alb", component="devops"}
                        | pattern `<type> <date> <elb_id> <client_ip> <pod_ip> <request_processing_time> <target_processing_time> <response_processing_time> <elb_code> <target_code> <received_bytes> <sent_bytes> "<request>" "<user_agent>" <ssl_cipher> <ssl_protocol> <target_group_arn> "<trace_id>" "<domain>" "<chosen_cert_arn>" <matched_rule_priority> <request_creation_time> "<actions_executed>" "<redirect_url>" "<error_reason>" "<target>" "<target_status_code>" "<_>" "<_>"`
                        | domain="test-alb-logs-1.setevoy.org.ua"
                        [1m] offset 5m
                )
            )
Let’s check the result now:

To make sure, let’s run a test with 2 requests per second:
$ wrk2 -c2 -t2 -R2 -H "User-Agent: wrk2" -d120m https://test-alb-logs-1.setevoy.org.ua/
Wait for 5–7 minutes, and check the chart again:

Okay, that’s settled, let’s move on.
A LogQL query for the response time
What do we need: to have an idea of how long the entire process of responding to a customer takes — from receiving an ALB request to sending a response.
We have three fields in our logs for this purpose:
-
request_processing_time: time from receiving a request from the client to transmitting it to the Pod -
target_processing_time: time from sending a request to Pod to receiving a response from it -
response_processing_time: time from receiving a response from the Pod to the start of the response transmission to the client
So we can do three metrics, then get the total sum and get the total time.
To do this, we need:
- select logs with the Log Selector
- take the value from the
target_processing_timefield from the record - and get the average value for, for example, 1 minute
We will check with the target_processing_time, because we have the CloudWatch TargetResponseTime metric, which we can use to validate our results from the logs and our query.
The request will look like this:
avg_over_time (
    {logtype="alb"}
        | pattern `<type> <date> <elb_id> <client_ip> <pod_ip> <request_processing_time> <target_processing_time> <response_processing_time> <elb_code> <target_code> <received_bytes> <sent_bytes> "<request>" "<user_agent>" <ssl_cipher> <ssl_protocol> <target_group_arn> "<trace_id>" "<domain>" "<chosen_cert_arn>" <matched_rule_priority> <request_creation_time> "<actions_executed>" "<redirect_url>" "<error_reason>" "<target>" "<target_status_code>" "<_>" "<_>"`
        | __error__ =""
        | unwrap target_processing_time
        | target_processing_time >= 0
        | domain="test-alb-logs-1.setevoy.org.ua"
    [1m] offset 5m
) by (elb_id)
target_processing_time >= 0 is used because some records may have a value of -1:
This value is set to -1 if the load balancer can’t dispatch the request to a target
In fact, avg_over_time() performs sum_over_time() (the sum of unwrap target_processing_time of all values for 1 minute) divided by the value in the count_over_time() (the total number of records from the Log Selector {logtype="alb"}):
sum(sum_over_time (
    {logtype="alb"}
        | pattern `<type> <date> <elb_id> <client_ip> <pod_ip> <request_processing_time> <target_processing_time> <response_processing_time> <elb_code> <target_code> <received_bytes> <sent_bytes> "<request>" "<user_agent>" <ssl_cipher> <ssl_protocol> <target_group_arn> "<trace_id>" "<domain>" "<chosen_cert_arn>" <matched_rule_priority> <request_creation_time> "<actions_executed>" "<redirect_url>" "<error_reason>" "<target>" "<target_status_code>" "<_>" "<_>"`
        | __error__ =""
        | unwrap target_processing_time
        | target_processing_time >= 0
        | domain="test-alb-logs-1.setevoy.org.ua"
    [1m] offset 5m
))
/
sum(count_over_time (
    {logtype="alb"}
        | pattern `<type> <date> <elb_id> <client_ip> <pod_ip> <request_processing_time> <target_processing_time> <response_processing_time> <elb_code> <target_code> <received_bytes> <sent_bytes> "<request>" "<user_agent>" <ssl_cipher> <ssl_protocol> <target_group_arn> "<trace_id>" "<domain>" "<chosen_cert_arn>" <matched_rule_priority> <request_creation_time> "<actions_executed>" "<redirect_url>" "<error_reason>" "<target>" "<target_status_code>" "<_>" "<_>"`
        | __error__ =""
        | target_processing_time >= 0
        | domain="test-alb-logs-1.setevoy.org.ua"
    [1m] offset 5m
))
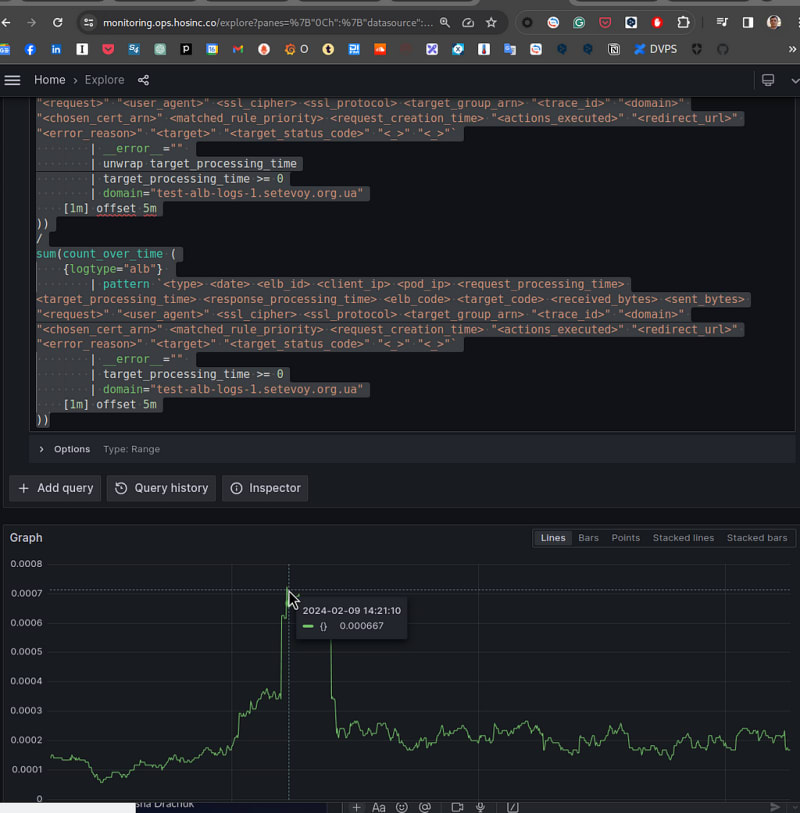
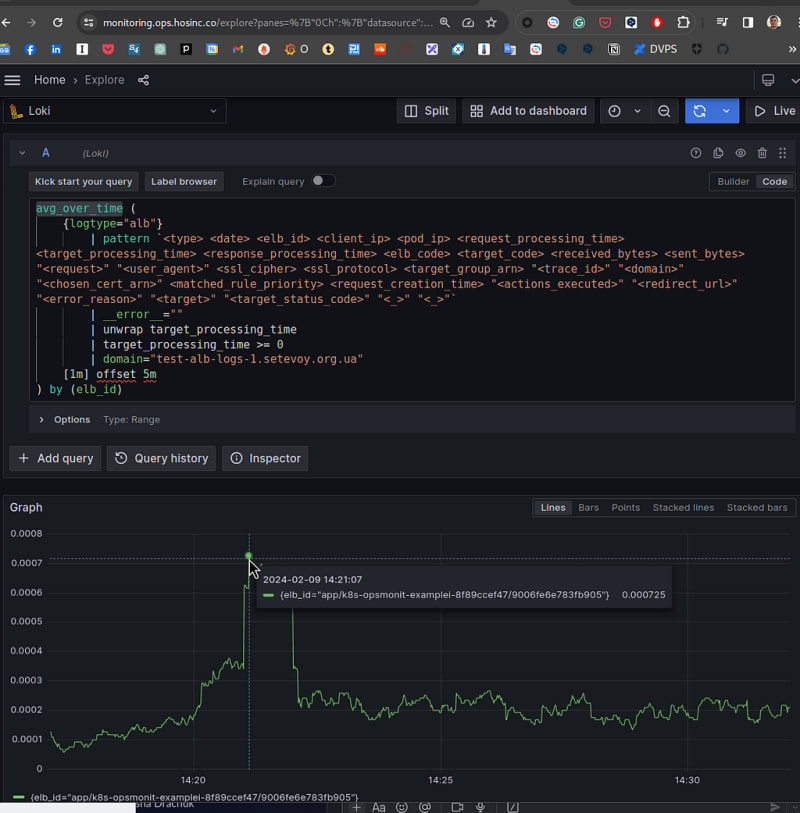
And let’s compare the result with CloudWatch — 14:21 on our graph is 14:16 in CloudWatch, because we use offset 5m:
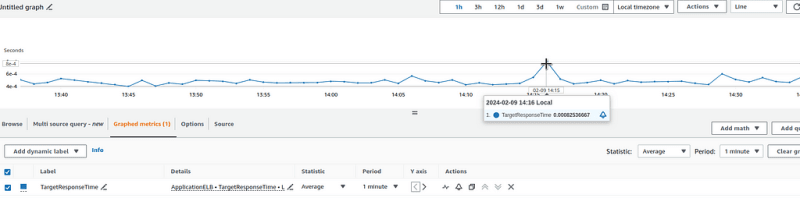
0.0008 of CloudWatch and 0.0007 of us. Basically, it’s correct.
Or we can take the 99th percentile:
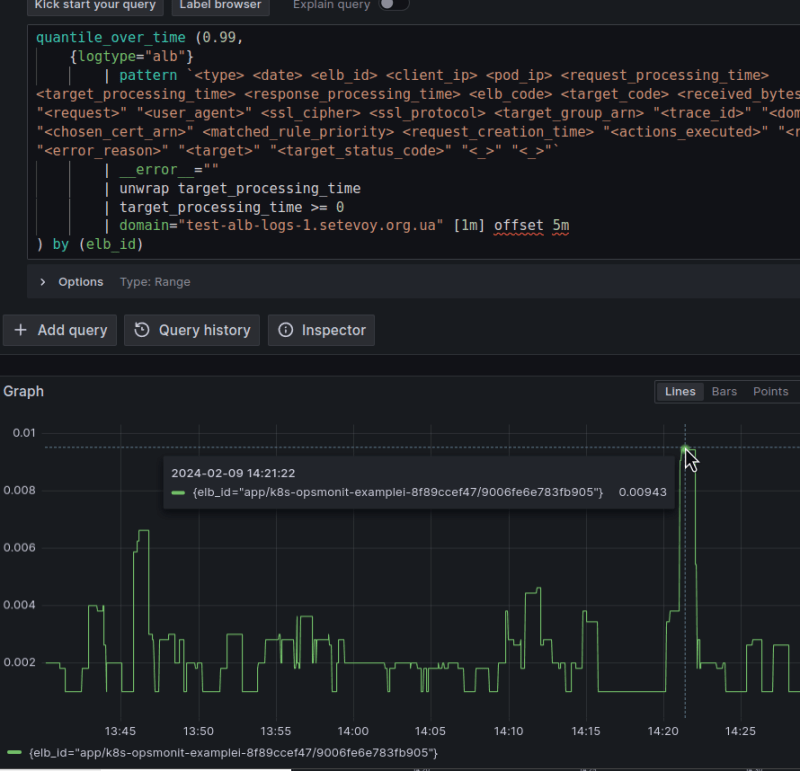
And it’s the same with CloudWatch:

Add a Recording Rule aws:alb:target_processing_time:percentile:99:
- record: aws:alb:target_processing_time:percentile:99
  expr: |
    quantile_over_time (0.99,
        {logtype="alb"}
            | pattern `<type> <date> <elb_id> <client_ip> <pod_ip> <request_processing_time> <target_processing_time> <response_processing_time> <elb_code> <target_code> <received_bytes> <sent_bytes> "<request>" "<user_agent>" <ssl_cipher> <ssl_protocol> <target_group_arn> "<trace_id>" "<domain>" "<chosen_cert_arn>" <matched_rule_priority> <request_creation_time> "<actions_executed>" "<redirect_url>" "<error_reason>" "<target>" "<target_status_code>" "<_>" "<_>"`
            | __error__ =""
            | unwrap target_processing_time
            | target_processing_time >= 0
            | domain="test-alb-logs-1.setevoy.org.ua" [1m] offset 5m
    ) by (elb_id)
And check it in VictoriaMetrics:

Let’s compare it with CloudWatch once again:

Okay, that’s done too.
The following is statistics on 4xx, 5xx, and all codes in general.
A LogQL query for the 4xx and 5xx errors rate
Everything is simple here — we can take our very first query and add it to sum by (elb_code):
sum by (elb_id, domain, elb_code) (
    rate(
        {logtype="alb", component="devops"}
            | pattern `<type> <date> <elb_id> <client_ip> <pod_ip> <request_processing_time> <target_processing_time> <response_processing_time> <elb_code> <target_code> <received_bytes> <sent_bytes> "<request>" "<user_agent>" <ssl_cipher> <ssl_protocol> <target_group_arn> "<trace_id>" "<domain>" "<chosen_cert_arn>" <matched_rule_priority> <request_creation_time> "<actions_executed>" "<redirect_url>" "<error_reason>" "<target>" "<target_status_code>" "<_>" "<_>"`
            | domain="test-alb-logs-1.setevoy.org.ua"
            [1m] offset 5m
    )
)
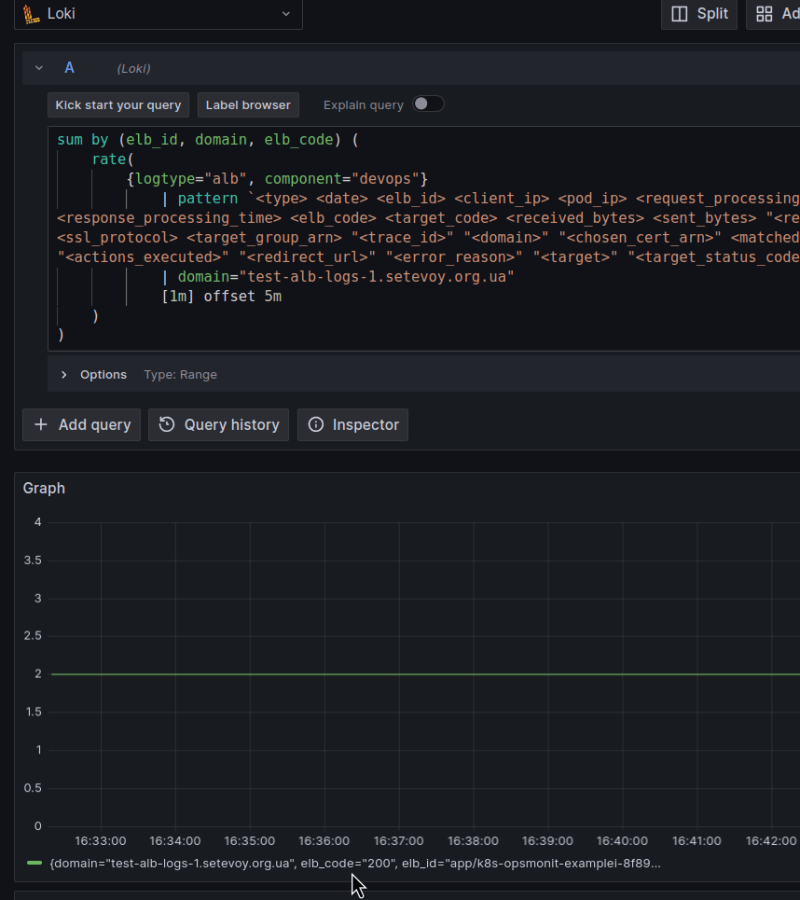
We are still have running wrk2 for 2 requests per second - that's why we see them.
Let’s add another call for the same 2 requests per second, but to a non-existent page to get a 404 code:
$ wrk2 -c2 -t2 -R2 -H "User-Agent: wrk2" -d120m https://test-alb-logs-1.setevoy.org.ua/404-page
And while it reaches the logs, create a metric:
- record: aws:alb:requests:sum_by:elb_http_codes_rate:1m:offset:5m
  expr: |
    sum by (elb_id, domain, elb_code) (
        rate(
            {logtype="alb", component="devops"}
                | pattern `<type> <date> <elb_id> <client_ip> <pod_ip> <request_processing_time> <target_processing_time> <response_processing_time> <elb_code> <target_code> <received_bytes> <sent_bytes> "<request>" "<user_agent>" <ssl_cipher> <ssl_protocol> <target_group_arn> "<trace_id>" "<domain>" "<chosen_cert_arn>" <matched_rule_priority> <request_creation_time> "<actions_executed>" "<redirect_url>" "<error_reason>" "<target>" "<target_status_code>" "<_>" "<_>"`
                | domain="test-alb-logs-1.setevoy.org.ua"
                [1m] offset 5m
        )
    )
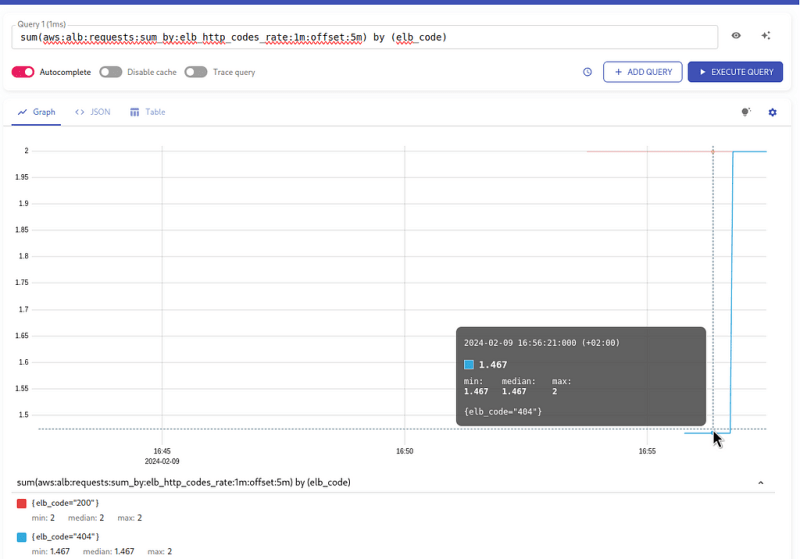
Actually, we can use it for our first task — the total number of requests per second, just do sum() on all received codes.
Do the same if you need to have metrics/graphs by codes from TargetGroups, but instead of sum by (elb_id, domain, elb_code) do sum by (elb_id, domain, target_code).
A LogQL query for the received a transmitted bytes
The CloudWatch metric ProcessedBytes has a total value for received/transmitted bytes, but I would like to see them separately.
So, we have 2 requests per second from the wrk2.
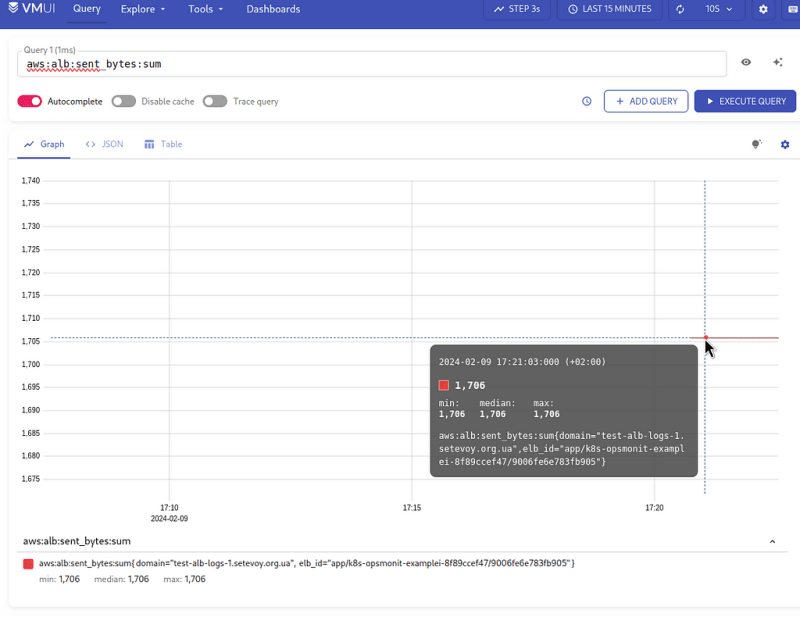
Let’s look at the log for the value of the sent_bytes field:

For each request with a 200 code, we send a response of 853 bytes, which means that for two requests per second, we send 1706 bytes per second.
Let’s make a request:
sum by (elb_id, domain) (
    sum_over_time(
        (
            {logtype="alb"}
            | pattern `<type> <date> <elb_id> <client_ip> <pod_ip> <request_processing_time> <target_processing_time> <response_processing_time> <elb_code> <target_code> <received_bytes> <sent_bytes> "<request>" "<user_agent>" <ssl_cipher> <ssl_protocol> <target_group_arn> "<trace_id>" "<domain>" "<chosen_cert_arn>" <matched_rule_priority> <request_creation_time> "<actions_executed>" "<redirect_url>" "<error_reason>" "<target>" "<target_status_code>" "<_>" "<_>"`
            | __error__ =""
            | domain="test-alb-logs-1.setevoy.org.ua"
            | unwrap sent_bytes
        )[1s]
    )
)
Here, we take the value of the sent_bytes field from unwrap sent_bytes, pass it to sum_over_time[1s], and get our 1706 bytes per second:

Add a Recording Rule:
- record: aws:alb:sent_bytes:sum
  expr: |
    sum by (elb_id, domain) (
        sum_over_time(
            (
                {logtype="alb"}
                | pattern `<type> <date> <elb_id> <client_ip> <pod_ip> <request_processing_time> <target_processing_time> <response_processing_time> <elb_code> <target_code> <received_bytes> <sent_bytes> "<request>" "<user_agent>" <ssl_cipher> <ssl_protocol> <target_group_arn> "<trace_id>" "<domain>" "<chosen_cert_arn>" <matched_rule_priority> <request_creation_time> "<actions_executed>" "<redirect_url>" "<error_reason>" "<target>" "<target_status_code>" "<_>" "<_>"`
                | __error__ =""
                | domain="test-alb-logs-1.setevoy.org.ua"
                | unwrap sent_bytes
            )[1s] offset 5m
        )
    )
And we have data in VictoriaMetrics:
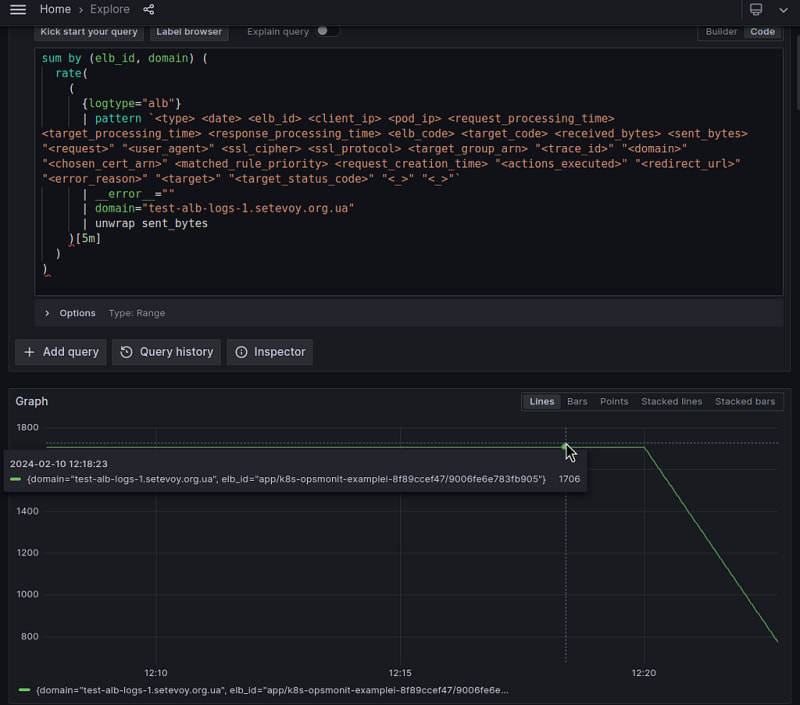
Or you can do the same thing, but using the rate() function:
sum by (elb_id, domain) (
  rate(
    (
      {logtype="alb"}
      | pattern `<type> <date> <elb_id> <client_ip> <pod_ip> <request_processing_time> <target_processing_time> <response_processing_time> <elb_code> <target_code> <received_bytes> <sent_bytes> "<request>" "<user_agent>" <ssl_cipher> <ssl_protocol> <target_group_arn> "<trace_id>" "<domain>" "<chosen_cert_arn>" <matched_rule_priority> <request_creation_time> "<actions_executed>" "<redirect_url>" "<error_reason>" "<target>" "<target_status_code>" "<_>" "<_>"`
      | __error__ =""
      | domain="test-alb-logs-1.setevoy.org.ua"
      | unwrap sent_bytes
    )[5m]
  )
)
For Recording Rules, add offset 5m:
- record: aws:alb:sent_bytes:rate:5m:offset:5m
  expr: |
    sum by (elb_id, domain) (
      rate(
        (
          {logtype="alb"}
          | pattern `<type> <date> <elb_id> <client_ip> <pod_ip> <request_processing_time> <target_processing_time> <response_processing_time> <elb_code> <target_code> <received_bytes> <sent_bytes> "<request>" "<user_agent>" <ssl_cipher> <ssl_protocol> <target_group_arn> "<trace_id>" "<domain>" "<chosen_cert_arn>" <matched_rule_priority> <request_creation_time> "<actions_executed>" "<redirect_url>" "<error_reason>" "<target>" "<target_status_code>" "<_>" "<_>"`
          | __error__ =""
          | domain="test-alb-logs-1.setevoy.org.ua"
          | unwrap sent_bytes
        )[1m] offset 5m
      )
    )

Do the same for received_bytes.
A LogQL query for the Client Connections
How can we count the number of connections to ALB? Because CloudWatch doesn’t have such a metric.
Each TCP Connection is formed from a pair Client_IP:Client_Port — Destination_IP:Destination_Port — see A brief overview of TCP/IP communications.
In the logs, we have the client_ip field with values like "178.158.203.100:41426", where 41426 is the local TCP port on my laptop that is used as part of this connection to the Load Balancer destination.
So, we can take the number of unique client_ip in the logs per second and get the number of TCP sessions, i.e. connections.
Let’s make the following request:
sum by (elb_id, domain) (
    sum by (elb_id, domain, client_ip) (
        count_over_time(
            (
                {logtype="alb"}
                | pattern `<type> <date> <elb_id> <client_ip> <pod_ip> <request_processing_time> <target_processing_time> <response_processing_time> <elb_code> <target_code> <received_bytes> <sent_bytes> "<request>" "<user_agent>" <ssl_cipher> <ssl_protocol> <target_group_arn> "<trace_id>" "<domain>" "<chosen_cert_arn>" <matched_rule_priority> <request_creation_time> "<actions_executed>" "<redirect_url>" "<error_reason>" "<target>" "<target_status_code>" "<_>" "<_>"`
                | __error__ =""
                | domain="test-alb-logs-1.setevoy.org.ua"
            )[1s]
        )
    )
)
Here:
- using
count_over_time()[1s]we take the number of log entries for the last second - wrap the result in
sum by (elb_id, domain, client_ip)- here we useclient_ipto get unique values for each Client_IP:Client_Port, and get the number of unique values for the fieldselb_id, domain, client_ip - and then wrap it again in
sum by (elb_id, domain)- to get the total number of such unique records for each Load Balancer and Domain
To check, run another instance of wrk2, and after a couple of minutes add another one, and we have 4 connections:

(spikes, probably, additional connections that wrk2 makes at startup)
Or the same thing, but with rate() per 1 minute - to make the graph more polished:
sum by (elb_id, domain) (
    sum by (elb_id, domain, client_ip) (
        rate(
            (
                {logtype="alb"}
                | pattern `<type> <date> <elb_id> <client_ip> <pod_ip> <request_processing_time> <target_processing_time> <response_processing_time> <elb_code> <target_code> <received_bytes> <sent_bytes> "<request>" "<user_agent>" <ssl_cipher> <ssl_protocol> <target_group_arn> "<trace_id>" "<domain>" "<chosen_cert_arn>" <matched_rule_priority> <request_creation_time> "<actions_executed>" "<redirect_url>" "<error_reason>" "<target>" "<target_status_code>" "<_>" "<_>"`
                | __error__ =""
                | domain="test-alb-logs-1.setevoy.org.ua"
            )[1m] offset 5m
        )
    )
)

And actually, that’s all. With such requests, we can build a board.
Loki Recording Rules, Prometheus/VictoriaMetrics, and High Cardinality
I’d like to add something on the topic of creating labels: it would be really cool to create a metric that would have, for example, target/Pod IP or client IP in its labels.
However, this will lead to such a phenomenon as “ High Cardinality ”:
Any additional log lines that match those combinations of label/values would be added to the existing stream. If another unique combination of labels comes in (e.g. status_code=”500”) another new stream is created.
Imagine now if you set a label for ip. Not only does every request from a user become a unique stream. Every request with a different action or status_code from the same user will get its own stream.
Doing some quick math, if there are maybe four common actions (GET, PUT, POST, DELETE) and maybe four common status codes (although there could be more than four!), this would be 16 streams and 16 separate chunks. Now multiply this by every user if we use a label for ip. You can quickly have thousands or tens of thousands of streams.
This is high cardinality. This can kill Loki.
See How labels in Loki can make log queries faster and easier.
In our case, we generate a metric that we write to the VictoriaMetrics TSDB, and each additional label with a unique value will create additional time-series.
Also, check the Understanding Cardinality in Prometheus Monitoring and Grafana Loki and what can go wrong with label cardinality.
Originally published at RTFM: Linux, DevOps, and system administration.
Originally published at RTFM: Linux, DevOps, and system administration.


Top comments (0)