AWS: Trusted Advisor, part 2 — CloudWatch Alarms and Slack notifications

Continuing with the theme of the AWS Trusted Advisor service, let’s see how can we configure notifications about new findings.
The first part: AWS: Trusted Advisor, part 1 — its features overview.
To have notifications, we can use Trusted Advisor metrics from the CloudWatch, see their list on the Trusted Advisor metrics and dimensions page.
Then, CloudWatch will rise alerts, will send them to the AWS Simple Notifications Service (AWS SNS). from there we will get alerts in Opsgenie, and from there they will be forwarded to a Slack channel.
The idea is to be notified quickly once somebody will create for example an AWS Security Group opened to the world.
So, in this post we will configure CloudWatch Alarms, their sending to Slack, and will see how Trusted Advisor refreshes its data, so we can be notified for example daily (or hourly, although there are some limitations, see the Trusted Advisor refresh checks — frequency of updates part).
- Opsgenie configuration
- AWS Simple Notification Service configuration
- AWS Trusted Advisor: what to monitor?
- CloudWatch Alarms configuration
- Trusted Advisor refresh checks — frequency of updates
- Trusted Advisor — manual refresh
- Alert message in Slack configuration
Opsgenie configuration
In the Opsgenie, let’s create a new CloudWatch integration, that will be used for the Trusted Advisor alerts.
Go to the Opsgenie Settings > Integrations, and find the CloudWatch:
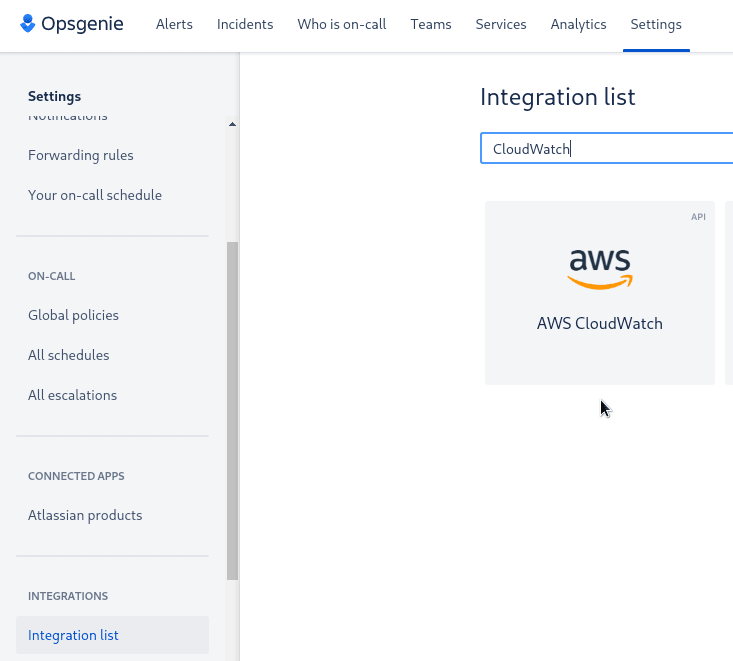
Let’s name it “TrustedAdvisor-Security”:

Save it, but we will go back here later to configure Slack messages text.
AWS Simple Notification Service configuration
AWS SNS needs to be configured in the us-east-1, N. Virginia, as some CloudWatch metrics are available only here, as it’s the very first (afaik) and oldest of the AWS data centers. так как часть метрик доступна Also, here we will configure CloudWatch Alarms.
Go to the SNS, create a new topic with the Standart type, name it as opsgenie-trustedadvisor-security-us-east-1-sns — seems to be a good idea to include a region and a service name to a SNS topic’s name:

After the topic is created, add a Subscription:

Copy the URL from the Opsgenie integration:

Go back to the SNS Subscription, specify the Protocol == HTTPS, and insert the URL from Opsgenie:

Save it, and let’s go to the CloudWatch.
AWS Trusted Advisor: what to monitor?
in this example, we will use the Security Groups — Specific Ports Unrestricted, but what’s in general?
Go to the AWS Trusted Advisor check reference, check the list, and choose the most appropriate for you.
As for me, those checks seems to be most interesting:
Cost optimization :
- Amazon RDS Idle DB Instances
- Idle Load Balancers
- Low Utilization Amazon EC2 Instances
- Unassociated Elastic IP Addresses
Performance :
- High Utilization Amazon EC2 Instances
- Amazon EC2 to EBS Throughput Optimization
Security :
- Security Groups — Specific Ports Unrestricted
- Security Groups — Unrestricted Access
- Amazon S3 Bucket Permissions
- Amazon RDS Security Group Access Risk
- ELB Security Groups
- Exposed Access Keys
By doing so, keep in mind that all Trusted Advisor findings are divided into three severity levels: Green, Yellow, and Red.
For the Security Groups — Specific Ports Unrestricted a level is determined by the following criteria (found them only in the Trusted Advisor Dashboard):

- Green: Access to port 80, 25, 443, or 465 is unrestricted.
- Red: Access to port 20, 21, 1433, 1434, 3306, 3389, 4333, 5432, or 5500 is unrestricted.
- Yellow: Access to any other port is unrestricted.
For now, let’s use the Red level to be alerted.
CloudWatch Alarms configuration
Go to the CloudWatch Alarms, create a new alert:

Кликаем Select metrics:

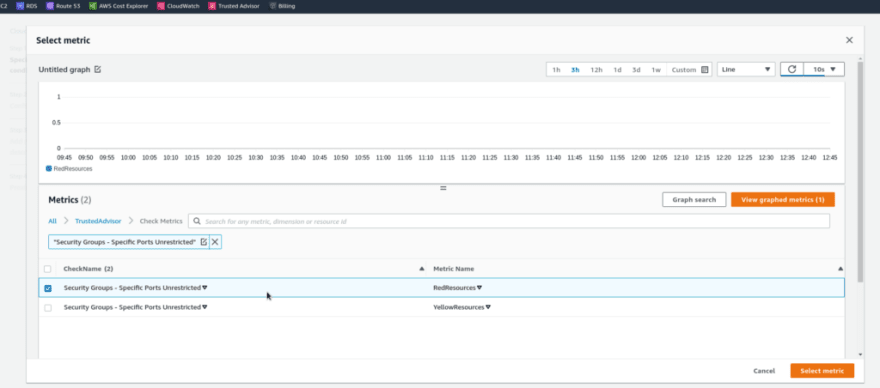
Find a necessary Trusted Advisor metric, in this current case it will be the Security Groups — Specific Ports Unrestricted — RedResources:
Set up when to fire this alert: in the Statistic use Simple Count:

in the Conditions choose Greater/Equal and value of 1, in the Additional configuration set the Treat missing data as good:

Next, configure Actions: send a notification to the SNS topic, created above:

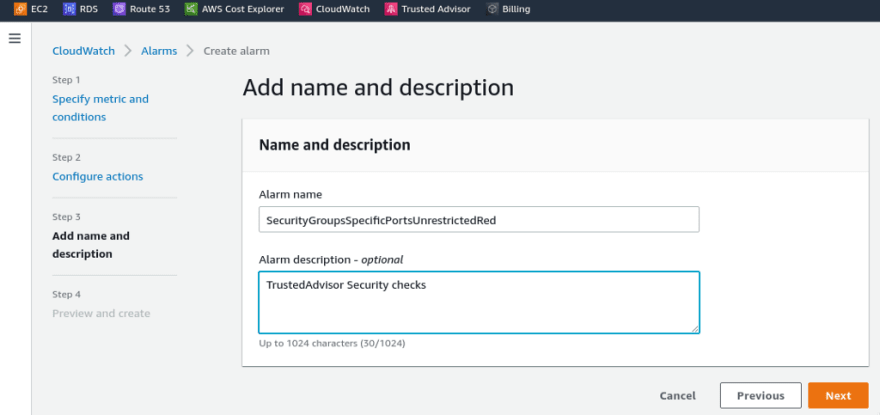
Set the alert’s name, optionally a description:
And let’s go to test it: create a SecurityGroup with the Allow rule from 0.0.0.0/0 to port 3306, so it must trigger the Red level:

Save the new Alarm, and wait for the alert… Wait… Wait…
Trusted Advisor refresh checks — frequency of updates
The reason for alerts not being triggered is how often Trusted Advisor refreshes its data: some checks are updated automatically, some — when you visit its dashboard or via AWS API or AWS CLI.
In our current case, let’s check the documentation of the Security Groups — Specific Ports Unrestricted check:

here we can see nothing about refresh. But -you can see the Check ID — we will use it soon to update the check manually.
But for the Amazon RDS Public Snapshots you can find, that it’s refreshed automatically several times per day, and you can not trigger its update manually:

Trusted Advisor — manual refresh
To run a manual refresh, we can:
- just open the TrustedAdvisor Dashboard and expand the Security Groups — Specific Ports Unrestricted
- can use the RefreshTrustedAdvisorCheck API call
- or by using AWS CLI and the refresh-trusted-advisor-check command
Let’s try with the CLI - use the command above, specify the AWS Region as us-east-1 (N. Virginia, where we did our alert), and in the --check-id set the ID mentioned above (also, you can get an ID by using the aws support describe-trusted-advisor-checks command):
$ aws --region us-east-1 support refresh-trusted-advisor-check --check-id HCP4007jGY
{
  “status”: {
    “checkId”: “HCP4007jGY”,
    “status”: “enqueued”,
    “millisUntilNextRefreshable”: 3599991
  }
}
The enqueued status means that the refresh request is accepted, and you’ll see the results in a few minutes.
if the status the field has the "success" value - then it was refreshed recently, and you have to wait for the millisUntilNextRefreshable (3599990 ms == 60 minutes).
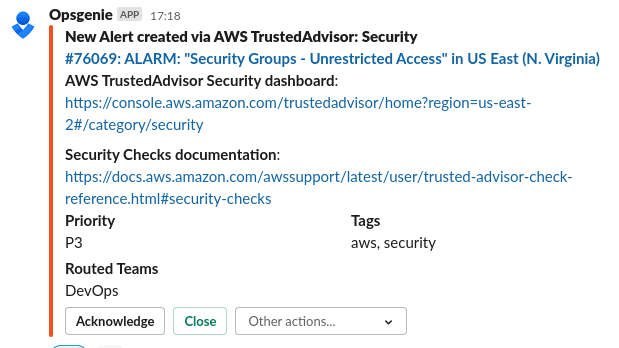
Eventually, we’ve got the alert in our Opsgenie:

And a message in a Slack channel:

Alert message in Slack configuration
The text in the message above is useless now — we only see it was triggered.
Let’s add some info there — go to the Slack integration settings, click on the Advanced:

And set the data you’d like to see there. For example, I’ve added two links — to the documentation, and Trusted Advisor’s dashboard:

Run the check again:
Done.
Originally published at RTFM: Linux, DevOps, and system administration.

Oldest comments (0)