IntelliJ IDEA offers functionality to help improve our coding, within the IDE when writing code as Intentions. Intentions can be used in batch to inspect code for patterns throughout the source and even extending to Command-Line analysis or added to Continuous Integration. This post covers the out of the box IntelliJ functionality and expanding with custom Intentions created in Sensei.
IntelliJ Inspections
The Inspections feature of IntelliJ drives the display of many of the errors that are reported dynamically in the IDE when coding e.g.
- detecting abstract classes that can be converted to interfaces,
- identifying redundant class fields which can be local,
- warning about uses of deprecated methods,
- etc.
These Inspections highlight code that matches in the IDE as Intention Actions which often have an associated QuickFix.

The real-time IDE highlighting when code matches an Inspection can help us improve our coding dynamically. After identifying the issue in the code, using IntelliJ Intention Actions to QuickFix the code can reinforce better patterns.
Inspections Profile
Inspections can run as a batch from within the IDE, and from the Command Line or in a Continuous Integration process.
The key to working with IntelliJ inspections in a batch is through the use of an Inspections Profile.
IntelliJ has two default Inspection Profiles: one stored in the Project, and one stored in the IDE.
New Inspection Profiles can be created to configure specific plugins or use-cases e.g.
- Run Checkstyle real-time scan only
- Run a specific set of Sensei rules
- Run the HTML checks
The Inspections in a profile can be enabled or disabled from the IntelliJ Preferences. The Preferences dialog is also an easy way to learn the range of Inspections available.

The ‘tool’ icon allows you to duplicate a Profile and create a new Profile to collect a specific set of rules.

Running an Inspection Profile in the IDE
Inspection Profiles can be run from within the IDE using the Analyze \ Inspect Code... menu.

The Analyze functionality allows you to control the scope that the Inspection will run against e.g. the whole project, including or excluding test sources, or against a specific set of files.

You can also manage the Inspection Profiles from here to create or configure a particular profile.
Clicking [OK] on the “Specify Inspection Scope” dialog will trigger IntelliJ into running all the selected Inspections in the profile across the defined scope.
IntelliJ will report the results of running the Inspections in the Inspection Results tab.

The Sensei plugin from Secure Code Warrior allows you to create custom code matching recipes. Sensei tightly integrates with IntelliJ to make these custom recipes as natural to use as the IntelliJ Intention Actions. Meaning they are loaded into IntelliJ as Inspections and can be grouped, enabled, and disabled using Inspection Profiles. Creating a custom Inspection Profile and then using the Analyze Inspect Code functionality is the recommended way of running Sensei recipes in bulk across a project.
Running an Inspection Profile from the Command Line
IntelliJ has the ability to run inspections from the command line as documented by JetBrains:
I primarily use Mac OS, and can run a single instance of IntelliJ from the command line with:
open -na "IntelliJ IDEA CE.app"
To support easier execution I add this to a shell command script.
vi /usr/local/bin/idea
The contents of the script are from the official documentation provided by IntelliJ.
#!/bin/sh

open -na "IntelliJ IDEA CE.app" --args "$@"
I then made this executable to allow me to simplify the command line inspection process.
chmod 755 /usr/local/bin/idea
The official intellij docs describe the general form of the inspection command as:
idea inspect <project> <inspection-profile> <output> [<options>]
In practice, I fully qualify the paths:
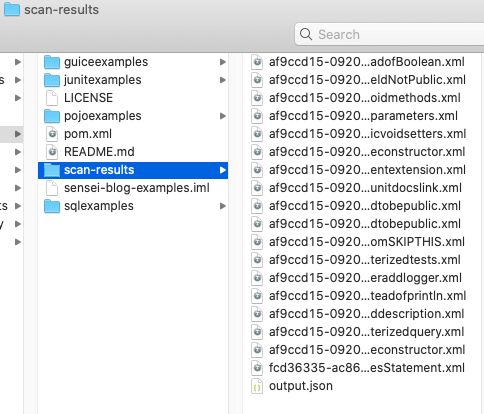
idea inspect /Users/user/GitHub/sensei-blog-examples /Users/user/GitHub/sensei-blog-examples/.idea/inspectionProfiles/senseiprofile.xml /Users/user/GitHub/sensei-blog-examples/scan-results
This runs all the Inspections I added to the senseiprofile and reports the results in the scan-results folder.
Viewing Inspection Results
We can report these results from within Continuous Integration, as we’ll see later.
We can also view them within IntelliJ itself using the Analyse \ View Offline Inspection Results… feature.

This will load the results into the Inspection Results tab.

This is officially documented on the JetBrains site:
This might be used during a code review process if the command line execution was incorporated into a Continuous Integration process and the reviewers wanted to check the full source context of any of the Inspection result entries.
Inspection Profiles in Continuous Integration
When adding the Command Line inspection into Continuous Integration we ideally want a report to be generated automatically and there are a number of options open to us.
TeamCity offers out of the box support for Inspection Profiles in Continuous Integration.
The Jenkins Warnings NG plugin supports the Command Line output from IntelliJ Inspections as one of the report formats.
- https://github.com/jenkinsci/warnings-ng-plugin
- https://github.com/jenkinsci/warnings-ng-plugin/blob/master/SUPPORTED-FORMATS.md
Community projects like idea CLI Inspector exist to support using Inspection Profiles in other CI tooling i.e.
The future of Inspection Profiles in a CI process looks even brighter with the introduction of the JetBrains Qodana project. The Qodana project is a headless version of IntelliJ with official Github Actions and Docker images.
Qodana is currently in beta, but the Sensei team is monitoring it so that it becomes an officially supported platform for running Sensei rules as part of Continuous Integration.
Summary
Intention Actions allow us to reinforce coding patterns and quickly fix them in the IDE when we make mistakes during coding.
Inspection Profiles allow us to collect these into profiles which can run in batch as an Analyze and Inspect Code action. This can be useful if we encounter a pattern and want to double-check if we have missed that anywhere else in our code.
Inspection Profiles can be run from the command line and even incorporated into Continuous Integration processes supporting a “trust, but verify” model and catch any accidental slippage.
All of the above is built in IntelliJ functionality and JetBrains are improving their Continuous Integration process with the introduction of Qodana.
Sensei recipes are loaded into IntelliJ to act as native Intention Actions and be collected into Inspection Profiles to support batch checking through Inspect Code and Continuous Integration support provided by the official JetBrains Command Line execution functionality.
You can install Sensei from within IntelliJ using "Preferences \ Plugins" (Mac) or "Settings \ Plugins" (Windows) then just search for "sensei secure code". Or install from the Jetbrains Marketplace Online

Top comments (0)