This is the third post in this series, discussing the usage of Power BI to visualize Azure Data Explorer data. If you followed those posts, we now have a report that uses 2 dimension tables for States and Sources loaded in Import mode (to reduce the number of queries being sent to ADX), and a facts table with StormEvents data, using Direct query mode (to have fresh, up-to-date data). The next thing to investigate, is how to use the dimension table, along with the recently announced Dynamic Parameters feature of Power BI.
Configuring the Dynamic Parameters in Power BI
First, let’s define SelectedStates and SelectedSources parameters in our model. We’ll define 2 parameters of type Text, mark them as required, and provide a default value:

Next, we need to bind each one of these parameters to the respective column in the dimension tables. This is done by selecting the columns in the model, and under the Advanced section, select the parameter in the “Bind to parameter” option:
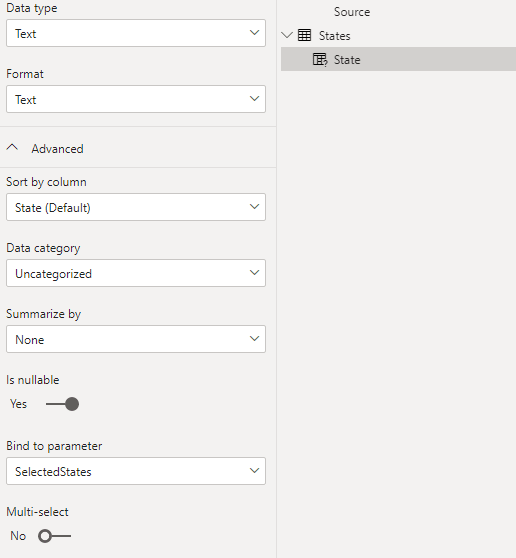
What this binding means, is that whenever we select a value in a slicer bound to the column, the Parameter’s value will be updated to the selected value. This will allow us to perform filtering, pass values to ADX functions, and so on. For this post, I’ll set Multi-select to false for the States, and to true for the Sources. This will allow me to demonstrate how to handle both a single value, and multiple values.
Updating the Azure Data Explorer queries
Now that we expect the selected values to be bound to our Parameters, we need to use those parameters in the Azure Data Explorer data source. We can do this in multiple ways:
- We can manually construct the ADX query we pass to the connector – I’ll use this method for the simpler State Parameter.
- We can use M to fold our query, saving us from having to manipulate strings – I’ll use this method for the multi-values Sources Parameter
- In a future post, when I’ll discuss using Azure Data Explorer functions in Power BI, we’ll also be able to pass the Parameter to an ADX function.
NOTICE: Options #2 and #3 are much more secure, since they avoid having to handle “KQL Injection” issues – if you work with strings, it’s your responsibility to make sure that the values passed to the Parameters are encoded as needed. One option to do so, is to use KQL’s query parameters statements, and passing the parameters as a default value.
For the State Parameter, I’ll first check is it’s not empty, and construct a KQL filter statement, which I’ll concat to my query:
StateFilter = if (SelectedStates is null or Text.Length(SelectedStates) = 0) then "" else " | where State == '" & SelectedStates & "'",
Source = AzureDataExplorer.Contents("https://help.kusto.windows.net", "Samples", "StormEvents" & StateFilter, [MaxRows=null, MaxSize=null, NoTruncate=null, AdditionalSetStatements=null])

For the multi-values Sources Parameter, we’ll just make sure that the value is of type List. If it is, we’ll use it to invoke M’s List.Contains() function. If not, we’ll assume it’s a single text value, and create list of it first.
SourcesList = if (SelectedSources is null) then { } else if (SelectedSources is text) then { SelectedSources } else SelectedSources,
Folded = if (List.Count(SourcesList) > 0) then
        Table.SelectRows(Source, each List.Contains(SourcesList, [Source]))
    else
        Source
Our final M query should look something like this:
let
    StateFilter = if (SelectedStates is null or Text.Length(SelectedStates) = 0) then "" else " | where State == '" & SelectedStates & "'",
    Source = AzureDataExplorer.Contents("https://help.kusto.windows.net", "Samples", "StormEvents" & StateFilter, [MaxRows=null, MaxSize=null, NoTruncate=null, AdditionalSetStatements=null]),
    SourcesList = if (SelectedSources is null) then { } else if (SelectedSources is text) then { SelectedSources } else SelectedSources,
    Folded = if (List.Count(SourcesList) > 0) then
            Table.SelectRows(Source, each List.Contains(SourcesList, [Source]))
        else
            Source
in
    Folded
We can check the KQL query that will be sent to our Azure Data Explorer cluster by selecting the “View Native Query” feature:

And you should see a KQL query similar to this, just as we expected
StormEvents | where State == 'ALABAMA'
| where ["Source"] in ("Newspaper")
Updating the relationships in our Power BI Model
Since we’re now responsible for “injecting” the selected values of slicers into our query, we need to remove any relationships we have between our dimensions tables and our facts tables. Otherwise, we’ll end up with conflicting and inconsistent filtering, which will result in empty result sets.
Visualizing our data
At this point, there’s nothing left to do – we can start using our visualizations just like we did before, and see the data refreshed as we make selections in the slicers:

Top comments (0)