
What is Velocity in Scrum?
Velocity is the amount of work a scrum team can accomplish during a single sprint. In other words, it is the amount of product backlog that the team turns into an increment of the end product in a given sprint. Velocity is a vital metric to know the rate at which the scrum team can deliver valuable products. The value is calculated after the sprint is over, by taking a total of the points for all completed user stories.
Making use of the velocity, the team can determine how long the project will take to complete. Based on this, they can accordingly revise the time for release if required. This determination takes into consideration the estimate for the remaining user stories. It also assumes that the velocity of the scrum team over the remaining iterations will be the same.
So we know the very basics of it, but let's understand the velocity in scrum in more detail. Read on to find out how it came into use and how it's calculated.
History
Velocity in Scrum is a concept whose exact origins are tough to trace. The concept came into being over a period of time and going back to the exact point isn't possible.
Some early works, such as 'Planning Extreme Programming' (yr: 2000) had mentions of Individual Velocity. Earlier, 'Ideal weeks' used to be estimated, but this was soon replaced by Story points. Instead of the number of weeks the project should ideally take, it was now the effort required that was considered.
In the 2000 book however, Velocity came into use as a replacement to the earlier term 'Load Factor'. A couple years later, in the year 2002, the Scrum users adopted the practice of measuring velocity.
Scrum Velocity Calculation and Example
To get an idea of the amount of work that the team will be able to complete, it is necessary to know the past performance. You can review the past three or so sprints to get a good idea of the average work that the team is capable of.
We have made use of story points in this example to calculate the work completed in each sprint. A quick reminder that story points is a measure of effort and time that a user story is expected to take. We've given more details about story point estimation using the Fibonacci series here. The following is a brief on how you can measure the performance. Consider the work over three sprints:
Sprint 1:
In this sprint, the team has agreed to complete six user stories.
Next, each user story has seven story points.
This means that the total number of story points in the sprint is 42.
At the end of the sprint, the team has completed five out of six user stories.
Sprint 2:
Here, the team has agreed upon seven user stories including one from the earlier sprint.
Again, the number of story points is seven, in this case, amounting to a total number of story points of 49.
By the end of this sprint, the team has completed five user stories.
Sprint 3:
In the third sprint, the team commits to working on eight user stories. This again includes two user stories from the earlier sprint.
The number of story points is the same as the other two, seven in each. As can be seen, the total number of story points is 56.
The team completes six user stories in total in this sprint.
Now that we have the data of three sprints, the next step is to calculate the average of the three sprints.
The average number of story points completed = Sum of story points completed in each sprint / Total number of sprints.
Story points completed in each sprint:
1 and 2 = 5 user stories * 7 story points = 35
3 = 6 user stories * 7 story points = 42
Therefore, the average number of story points is then calculated to be
(35 + 35 + 42)/3
=~37
Hence, this 37 is our average sprint velocity. The rest of the work is calculated based on this. For instance, if the team has to complete 220 more story points, dividing by 37 will give us a good estimate.
So, 22/37 = ~6
Thus the team would need around 6 more sprints to complete all the user stories. This is under the assumption that each sprint includes about 37 story points. Note that this is an approximation and there could be changes from one sprint to another. Hence, velocity in scrum can't be considered as an exact value.
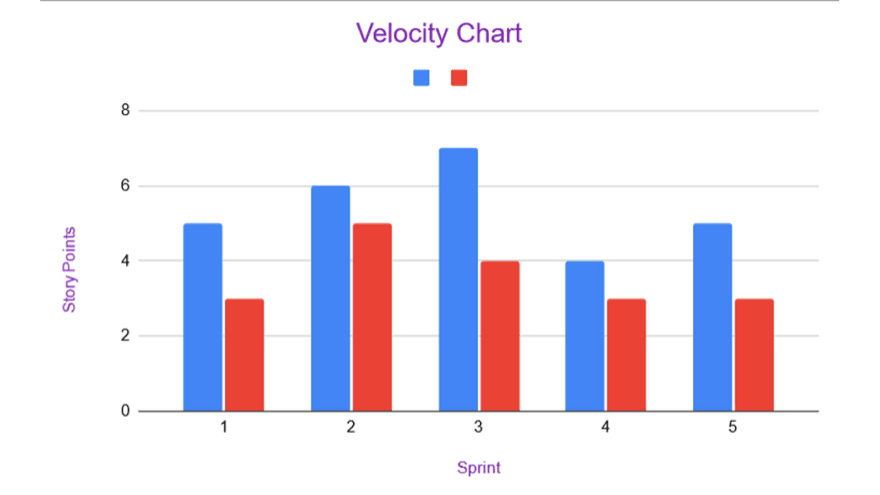
Velocity Chart
Teams make use of the velocity chart to visually track the progress of the work that they have done. The sprint burndown chart is also made use of for this purpose.
- The velocity chart is a graph of estimated story points against completed story points. It is a simple double bar graph which shows how many story points were committed to and how many were done.
- The burndown chart shows how much work is complete, what's left and the amount of time remaining for the same.
Originally published here.
P.S. If you liked the above blog also check out the following:

Top comments (0)