Introduction:
Random forest is a technique used in modeling predictions and behavior analysis and is built on decision trees.
It contains many decision trees representing a distinct instance of the classification of data input into the random forest that is used widely in Classification and Regression problems.
It builds decision trees on different samples and takes their majority vote for classification and average in case of regression.
One of the most important features of the Random Forest Algorithm is that it can handle the data set containing continuous variables as in the case of regression and categorical variables as in the case of classification.
Real Life Analogy:-

Working of Random Forest Algorithm:
Ensemble technique is an important technique that's why we need to know the Ensemble technique. Ensemble uses two types of methods:
1. Boosting :- Boosting combines weak learners into strong learners by creating sequential models such that the final model has the highest accuracy. For example, ADA BOOS, XG BOOST.
2. Bagging :- Bagging creates a different training subset from the sample training data with a replacement & the final output is based on majority voting. For example, Random Forest.

Coding in Python:-
1. Let's import the Libraries:-
import pandas as pd
import numpy as np
import matplotlib.pyplot as plt
import seaborn as sns
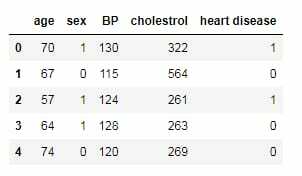
2. Importing data set:-
df = pd.read_csv('heart_v2.csv')
print(df.head())
sns.countplot(df['heart disease'])
plt.title('Value counts of heart disease patients')
plt.show()
3. Putting Feature Variable to X and Target Variable to Y:-
X = df.drop('heart disease',axis=1)
y = df['heart disease']
4. Train Test Split is Performed:-
from sklearn.model_selection import train_test_split
X_train, X_test, y_train, y_test = train_test_split(X, y, train_size=0.7, random_state=42)
X_train.shape, X_test.shape
![]()
5. Import Random Forest Classifier and fit the data:-
from sklearn.ensemble import RandomForestClassifier
classifier_rf = RandomForestClassifier(random_state=42, n_jobs=-1, max_depth=5, n_estimators=100, oob_score=True)
%%time
classifier_rf.fit(X_train, y_train)
classifier_rf.oob_score_

6. Hyperparameter tuning for Random Forest using GridSearchCV and fit the data:-
rf = RandomForestClassifier(random_state=42, n_jobs=-1)
params = {
    'max_depth': [2,3,5,10,20],
    'min_samples_leaf': [5,10,20,50,100,200],
    'n_estimators': [10,25,30,50,100,200]
}
from sklearn.model_selection import GridSearchCV
grid_search = GridSearchCV(estimator=rf, param_grid=params, cv = 4, n_jobs=-1, verbose=1, scoring="accuracy")
%%time
grid_search.fit(X_train, y_train)

grid_search.best_score_
![]()
rf_best = grid_search.best_estimator_
rf_best
![]()
7. Visualization:-
from sklearn.tree import plot_tree
plt.figure(figsize=(80,40))
plot_tree(rf_best.estimators_[5], feature_names = X.columns,class_names=['Disease', "No Disease"],filled=True);

from sklearn.tree import plot_tree
plt.figure(figsize=(80,40))
plot_tree(rf_best.estimators_[7], feature_names = X.columns,class_names=['Disease', "No Disease"],filled=True);

8. Sorting of Data according to feature importance:-
rf_best.feature_importances_
![]()
imp_df = pd.DataFrame({
    "Varname": X_train.columns,
    "Imp": rf_best.feature_importances_
})
imp_df.sort_values(by="Imp", ascending=False)

Summary:
Now, we can conclude that Random Forest is also a one of the best techniques with high performance which is widely used in various industries for its efficiency. It can handle binary, continuous, and categorical data.
Random Forest is a great choice if anyone wants to build the model fast and efficiently as one of the best things about the random forest is it can handle missing values too.
Overall, Random Forest is fast, simple, flexible and robust model with some limitations. Random forest is a combination of decision trees that can be modeled for prediction and behavior analysis.


Top comments (1)
Good keep it up