
This is a multipart blog article series, and in this series I am going to explain you the concepts of operating system. This article series is divided into multiple modules and this is the forth module which consists of 8 articles.
In this article we will see that what resource allocation graph in deadlock. In this article we will mainly focus on single instance.
Resource allocation graph
- How the resources are allocated to process and how the process have been assigned to multiple resource to represent that we use resource allocation graph (RAG)
- In our system deadlock is present or not, to represent that this is the most suitable way.
- Like any other graph it also has vertex and edges.
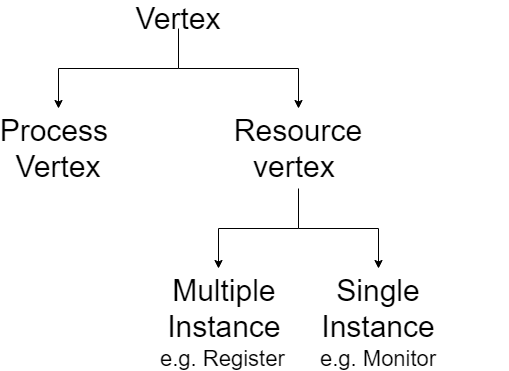
- All the processes running in our system are represented as vertex and generally represented as circle.
- All the resources in our system are represented by vertex, but with rectangle box.
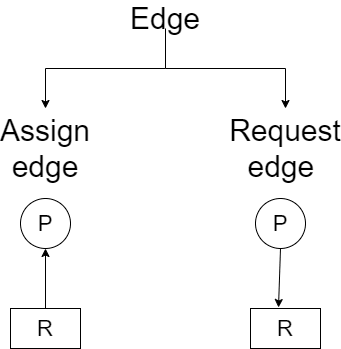
- Edges are of two types assign edge. If the arrow is going from resource to process than it means resource is allocated to that process.
- Request edge if arrow is going from process to resource it means process is asking for resource.
Let's see some examples to get better understanding of the concept.
Example 1: Resource R1 is allocated to process P1 and R2 to P2, P1 wants R2 and P2 wants R1. Check whether there is a deadlock present or not.
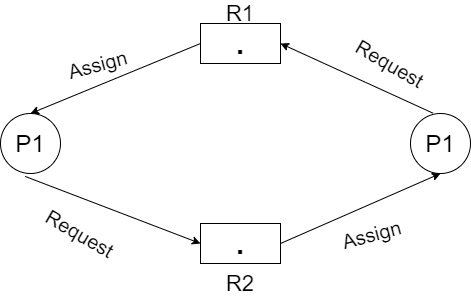
We do this kind of representation to check that whether there is a deadlock condition or not.
Another and recommended way to check the presence of deadlock.
| Process No. | Allocated R1 | Allocated R2 | Request R1 | Request R2 |
|---|---|---|---|---|
| P1 | 1 | 0 | 0 | 1 |
| P2 | 0 | 1 | 1 | 0 |
- Current availability: (0,0)
- Here
P1wants oneR2andP2wants oneR1, but as we can see the availability, we cannot fulfill the request which means that deadlock is present. - It has circular wait.
- If RAG has circular wait (cyclic), then there will always be deadlock in case of single instance.
Example 2: From the given RAG find out that is deadlock present in this case.

| Process No. | Allocated R1 | Allocated R2 | Request R1 | Request R2 |
|---|---|---|---|---|
| P1 | 1 | 0 | 0 | 0 |
| P2 | 0 | 1 | 0 | 0 |
| P3 | 0 | 0 | 1 | 1 |
- Current availability: (0,0)
- We can full fill the availability of
P1andP2because they are not requesting for any resource, so they will get terminated after some time and then the new availability will be. - Current availability: (1,1)
- By this new availability we can fulfill the request of
P3and then it will also get terminated after execution. - So, no deadlock is present in this example.
- This is acyclic because by following arrows we cannot come back to that point again.
- If RAG has no cycle then there will be no deadlock in the case of single instance.
Note
So this was all about resource allocation graph in deadlock. Hop you liked it and learned something new form it.
If you have any doubt, questions, quires related to this topic or just want to share something new with me, then please feel free to contact me.
📱 Contact Me
Twitter
LinkedIn
Telegram
Instagram

Top comments (0)