
This post is the continuation post in a tri-post series about PyGeneses. This post focuses mainly on one of the packages in PyGeneses which is VitaBoard. If you are unfamiliar with PyGeneses and want to know about it, these articles would help you get to speed.
So, now let's start with VitaBoard.
What is VitaBoard?
Vitaboard provides and advanced, and interactive dashboard to study the agents after their training phase is over. After each agent dies. his/her lifecycle, which contains all the actions he/she has performed, is written in a log file. These log files are used as the input in the VitaBoard which then allows the user to visualize the agent’s life in an easier manner. Vitaboard provides the user with a life visualizer, group statistics, and a genetic history visualizer. It allows the users to identify and understand behaviors shown by the particular agent while the other agents and the environment being the factors affecting them.
Getting Started with VitaBoard
To start using VitaBoard, PyGeneses must be installed in your system. If you have forgotten how that is done or have no knowledge about it, you can find it here.
To start the VitaBoard in your system, all you need is PyGeneses and python installed in your system.
Steps to run
- Run the following command in your terminal:
user@programmer~:$ vitaboard
- Open localhost:5000 or 127.0.0.1:5000 in any browser.
Various features of VitaBoard
- VitaViz
This is the first screen that the user sees when the VitaBoard opens in the browser.
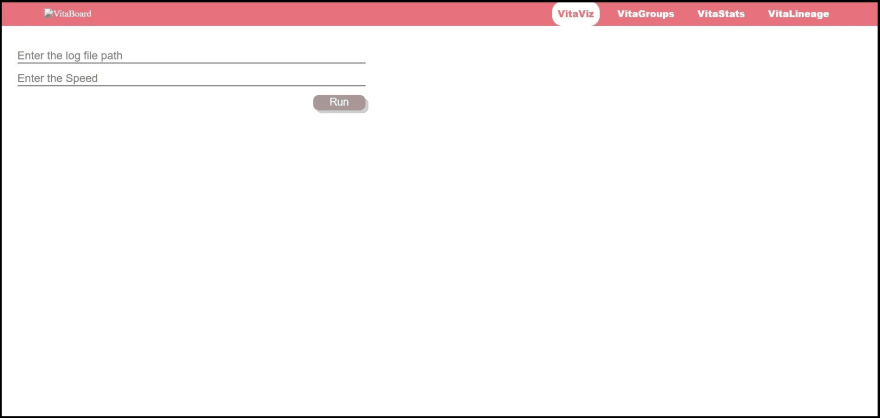
This is the VitaViz tab. This is used to visualize the lifecycle of the particular agent. An agent’s lifecycle can be visualized by using its log file which is generated when that particular agent dies.
So, to visualize the lifecycle, enter the location of the log file in the first field and set the speed with which you would like to see the lifecycle simulation in the second field (if you enter 1, the simulation speed would be 1 frame/sec).
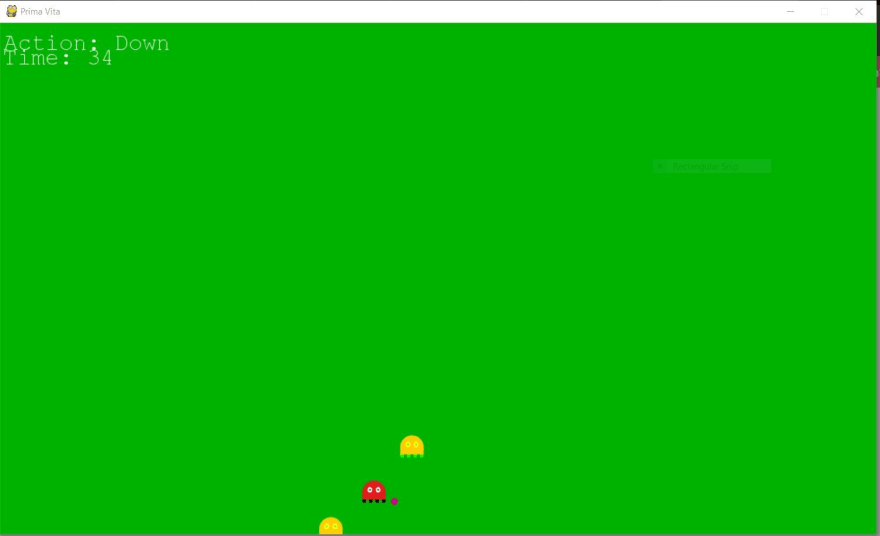
After entering the details and hitting ‘Run’, a pygame window opens which will display the simulation. The window looks like this.
- VitaGroups
This is the second tab, VitaGroups. This is used to form the clusters of agents based on their Neural Network embeddings. This tab looks like this.
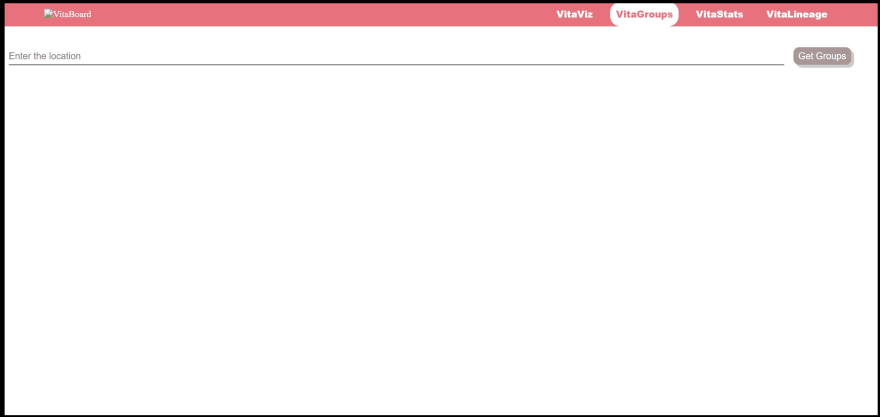 The input here is again the location of log files. The difference is in VitaViz the location given is of a single log file but in VitaGroups, the location of the entire folder is given which has the log files. Make sure that this folder has an embeddings folder inside it along with other log files. After entering the location, press the ‘Get Groups’ button, this will generate and show the cluster graph. These data points are generated by reducing the dimensions of the agent’s trained embeddings into two dimensions using t-SNE (t-distributed Stochastic Neighbour Embeddings).
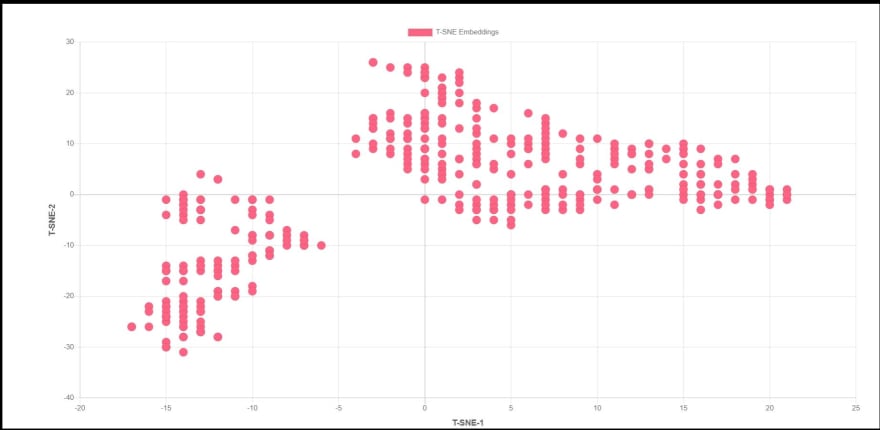 In this graph, the user can click on any node and the name of that agent will be displayed below, clicking on this again will enable the user to visualize the life of that agent which is similar to the feature in VitaViz tab.
- VitaStats
The next tab is VitaStats. This helps the user to visualize the various statistics about the agents.
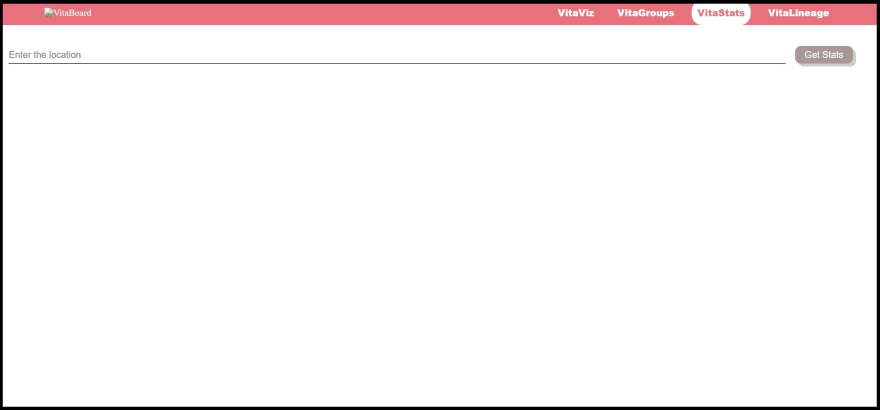 The location of log files is entered here. The location given as input here is similar to that of the location entered in the VitaGroups tab. After pressing the ‘Get Stats’ button, various graphs will be generated and displayed.
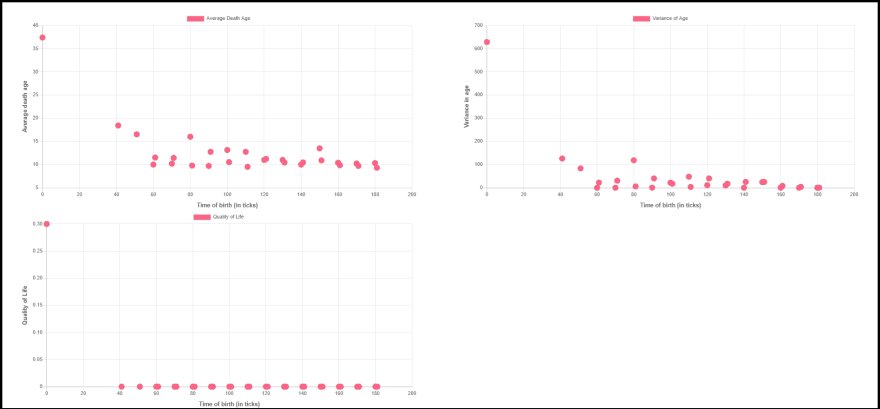 Here the user can click on any node of any graph to get a list of the agents born at that particular time-stamp. This list comes below the graphs. Clicking on any list item will enable the user to visualize the life of that agent.
The First Graph shows the relation between the average of the ages of the death of players born at a particular time and the time. This can be used to study the trends in the lifespans of the agents.
The second graph shows the relation between the variance in death ages of players born at a particular time and the time. This graph can be used to realize the similarities/dissimilarities in the death age of players born under at the same time and living in similar circumstances.
The third graph maps the relation between the Quality of Life and the time. Hereby quality of life we mean the count of players born at a particular time who survived for more than 50 timesteps (in ticks).
Here the user can click on any node of any graph to get a list of the agents born at that particular time-stamp. This list comes below the graphs. Clicking on any list item will enable the user to visualize the life of that agent.
The First Graph shows the relation between the average of the ages of the death of players born at a particular time and the time. This can be used to study the trends in the lifespans of the agents.
The second graph shows the relation between the variance in death ages of players born at a particular time and the time. This graph can be used to realize the similarities/dissimilarities in the death age of players born under at the same time and living in similar circumstances.
The third graph maps the relation between the Quality of Life and the time. Hereby quality of life we mean the count of players born at a particular time who survived for more than 50 timesteps (in ticks).
- VitaLineage
The last tab is VitaLineage. This is used to visualize the family tree of that particular agent.
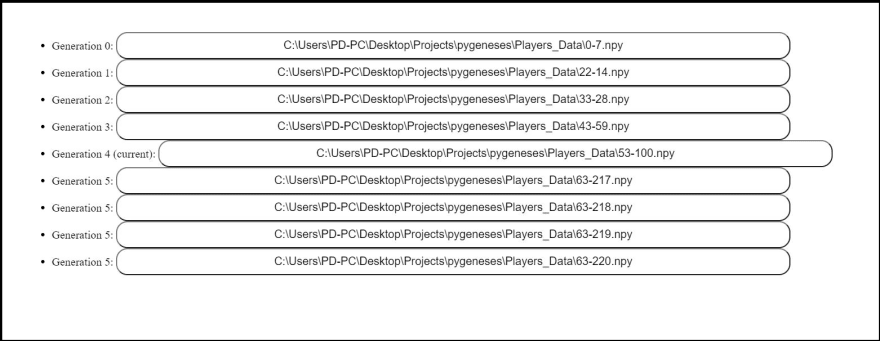
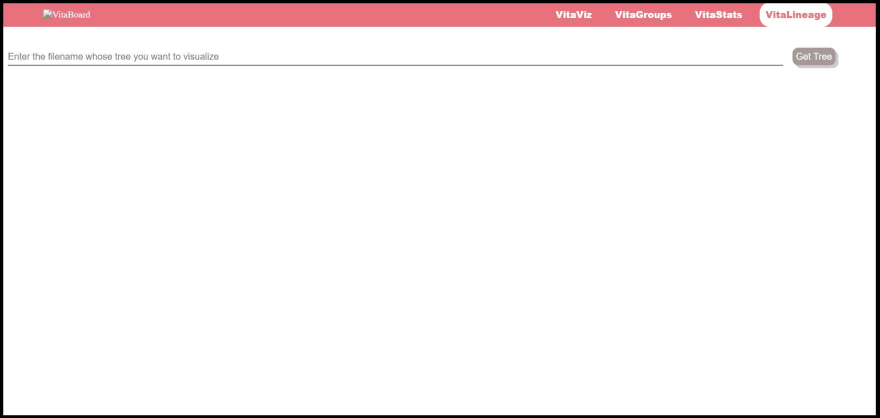 Give the location of a single log file of the agent and click on ‘Get Tree’. This gives the family tree of that agent. Click on any node to visualize the life of the agent.
 This was all about VitaBoard and the features it has to offer.his is an open-source project and would also be enlisted in the Hacktoberfest. I hope you all would consider this project and make contributions to improve and enhance this project. The GitHub link of this project can be found here. Hope to see you there.

Top comments (0)